Retail & Operations
Retail Analytics: Metrics, Examples, and SMB Use Cases
Track the sales, inventory, margin, and store metrics that support better retail decisions.
Retail AnalyticsInventoryAI Sheets
Read guidePractical guides for data analysis, spreadsheet-heavy finance, accounting, procurement, and operations workflows.

Track the sales, inventory, margin, and store metrics that support better retail decisions.

Control the PO lifecycle, track open commitments, resolve mismatches, and close orders with confidence.
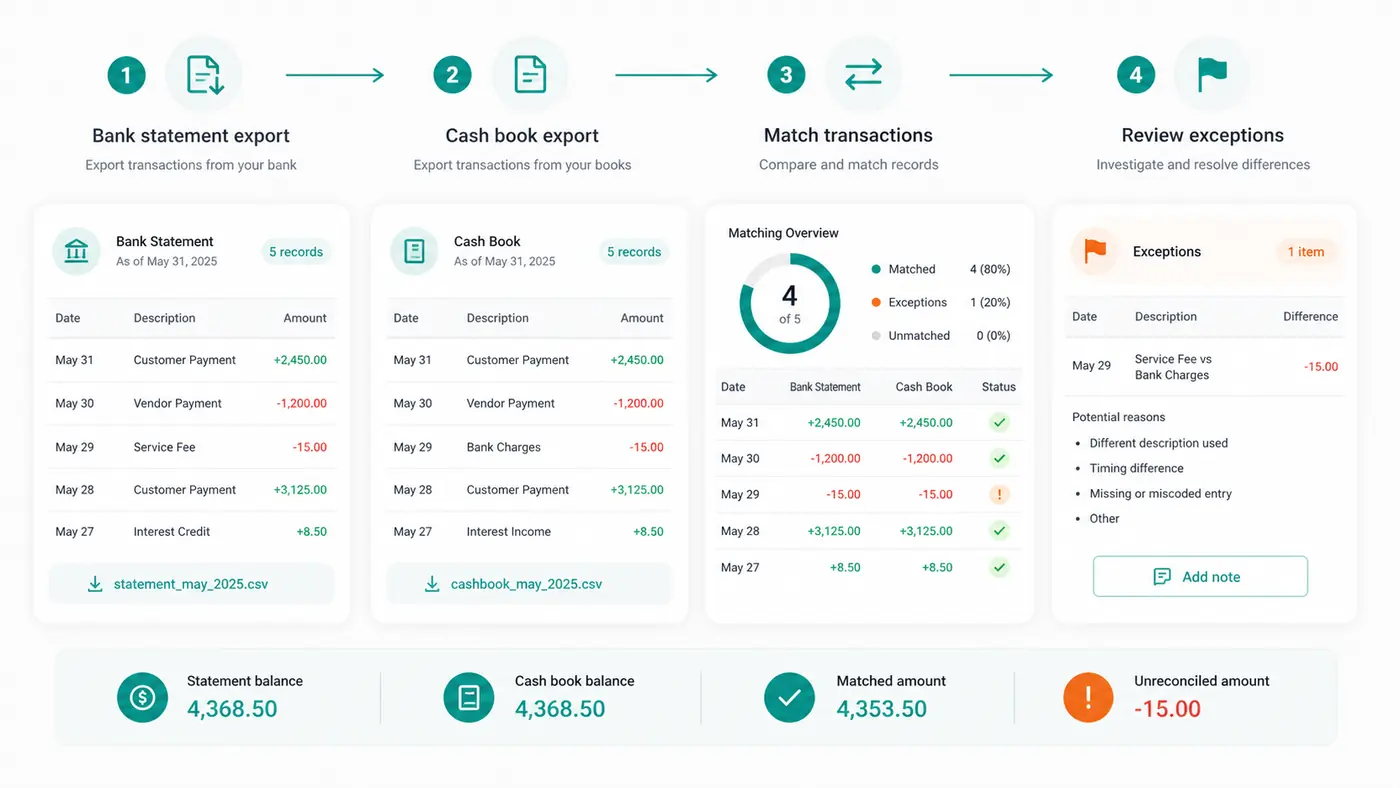
Explain why bank and book balances differ, and which items need adjusting.
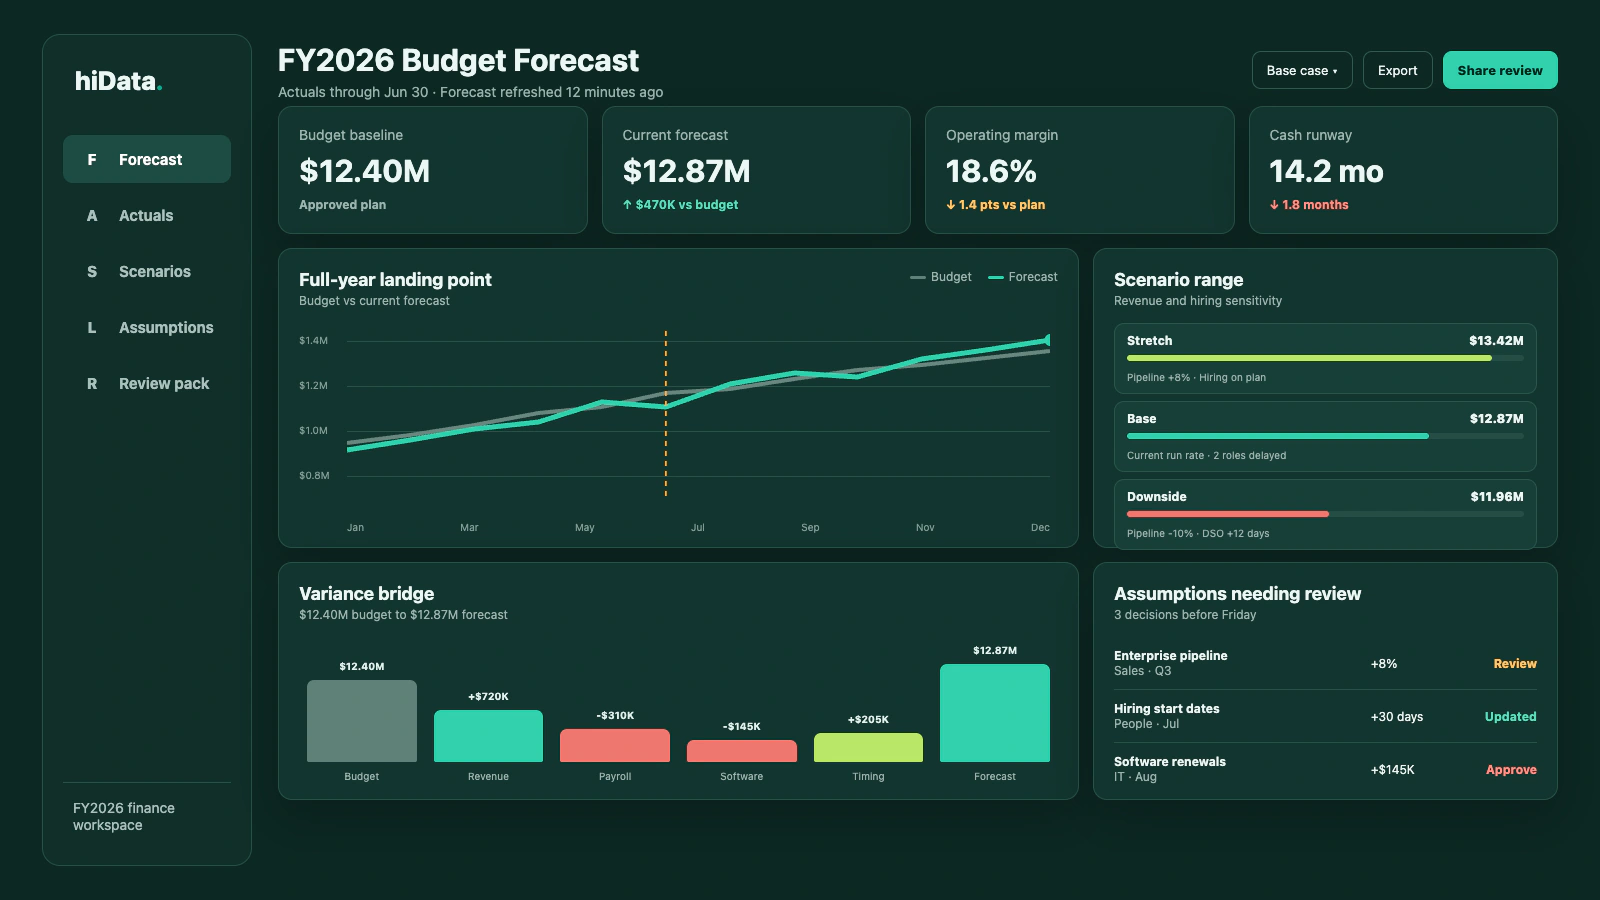
Compare budgets, actuals, and assumptions to build a forecast review pack.
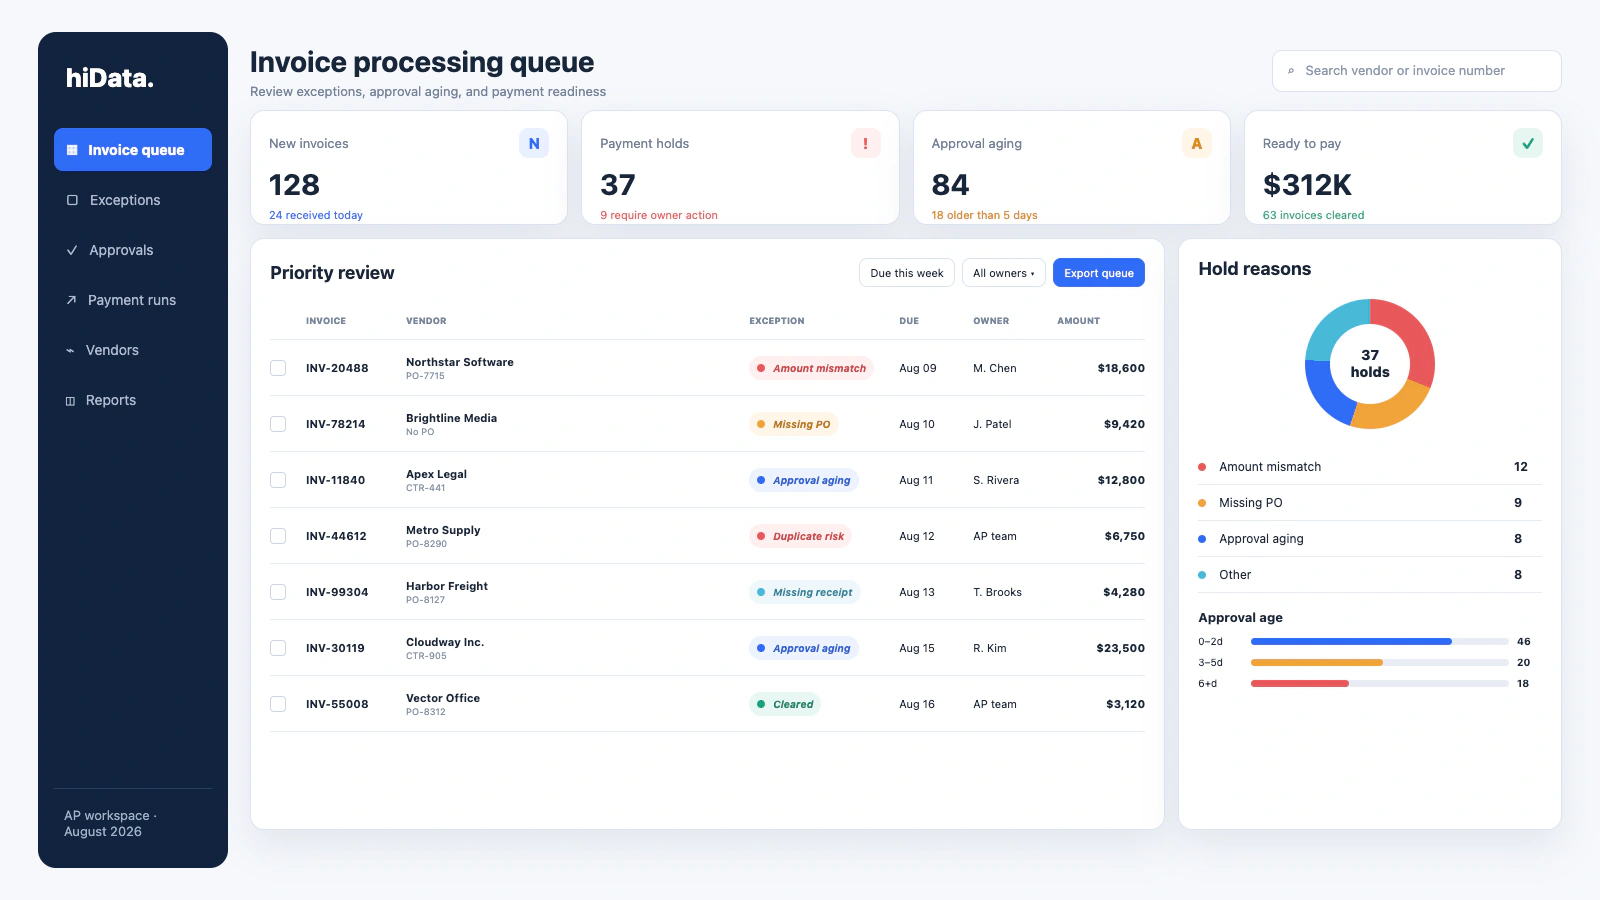
Review the AP queue for match holds, approval aging, and duplicate risk.

Turn a spreadsheet export into a small set of metrics and one clear action.
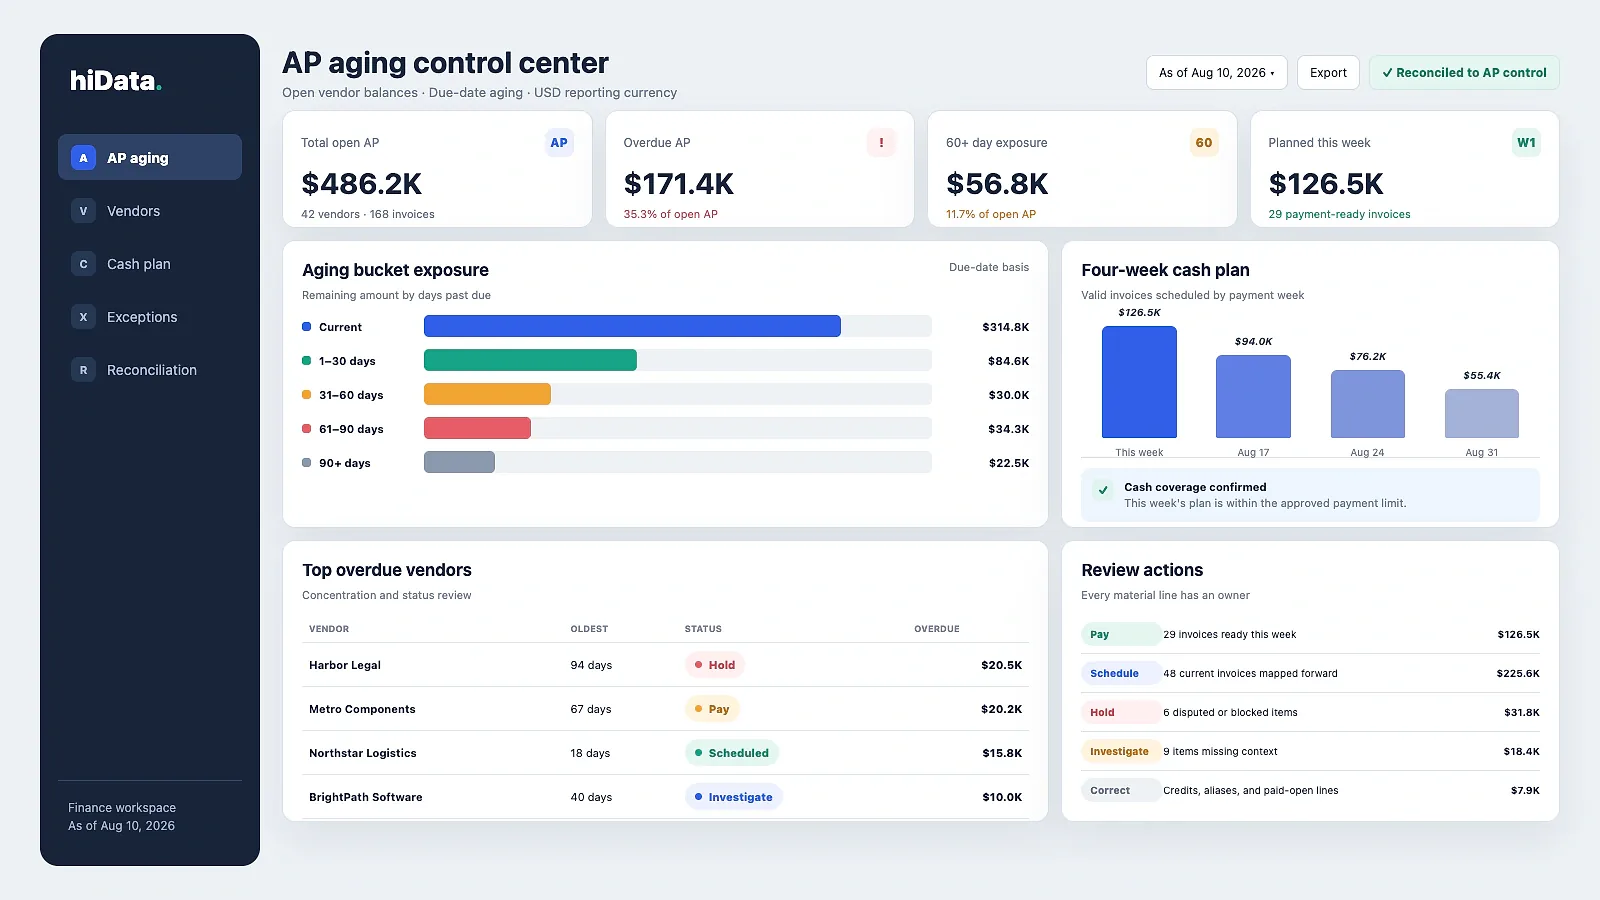
Build aging buckets, reconcile open balances, and turn overdue invoices into a payment plan.
Build AR aging buckets, organize overdue invoices, and turn receivables into a focused collections review.
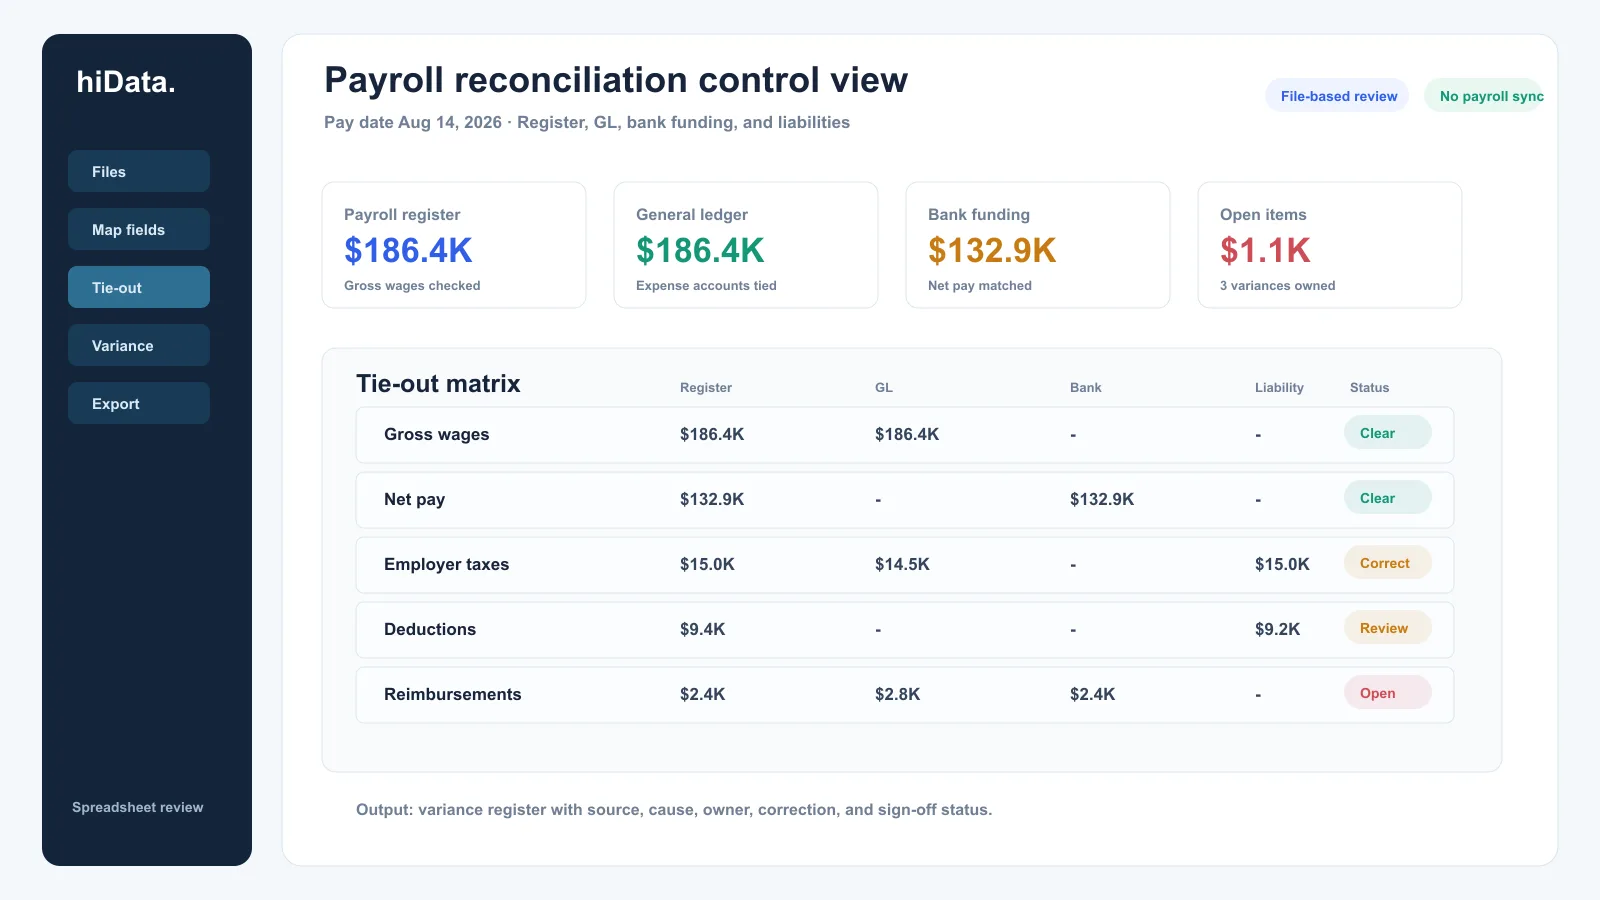
Match the payroll register to the GL, bank, and liabilities, then review what disagrees.
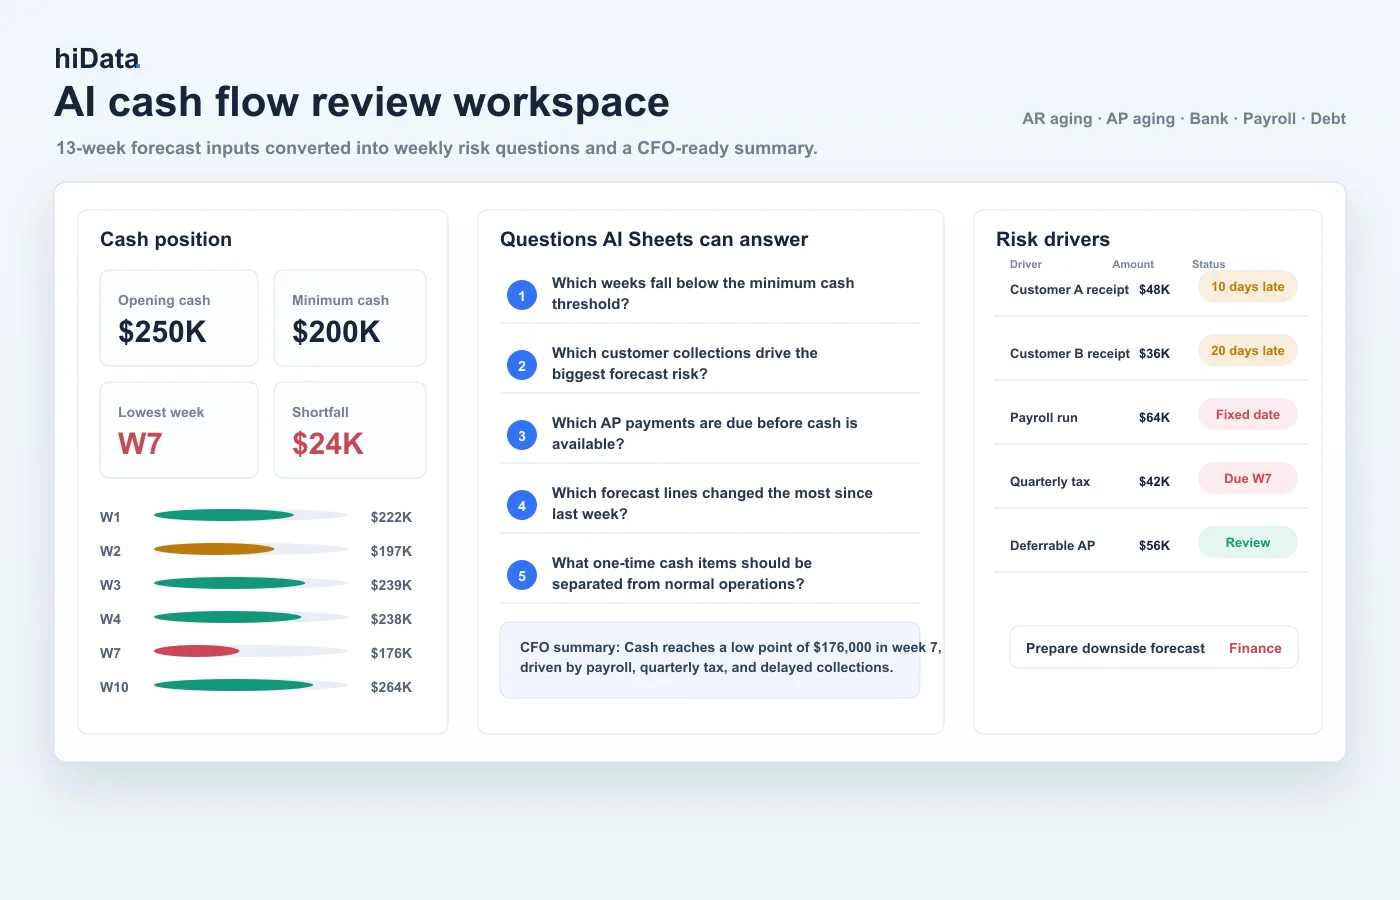
Build a rolling weekly view of cash in, cash out, and the low point before it arrives.
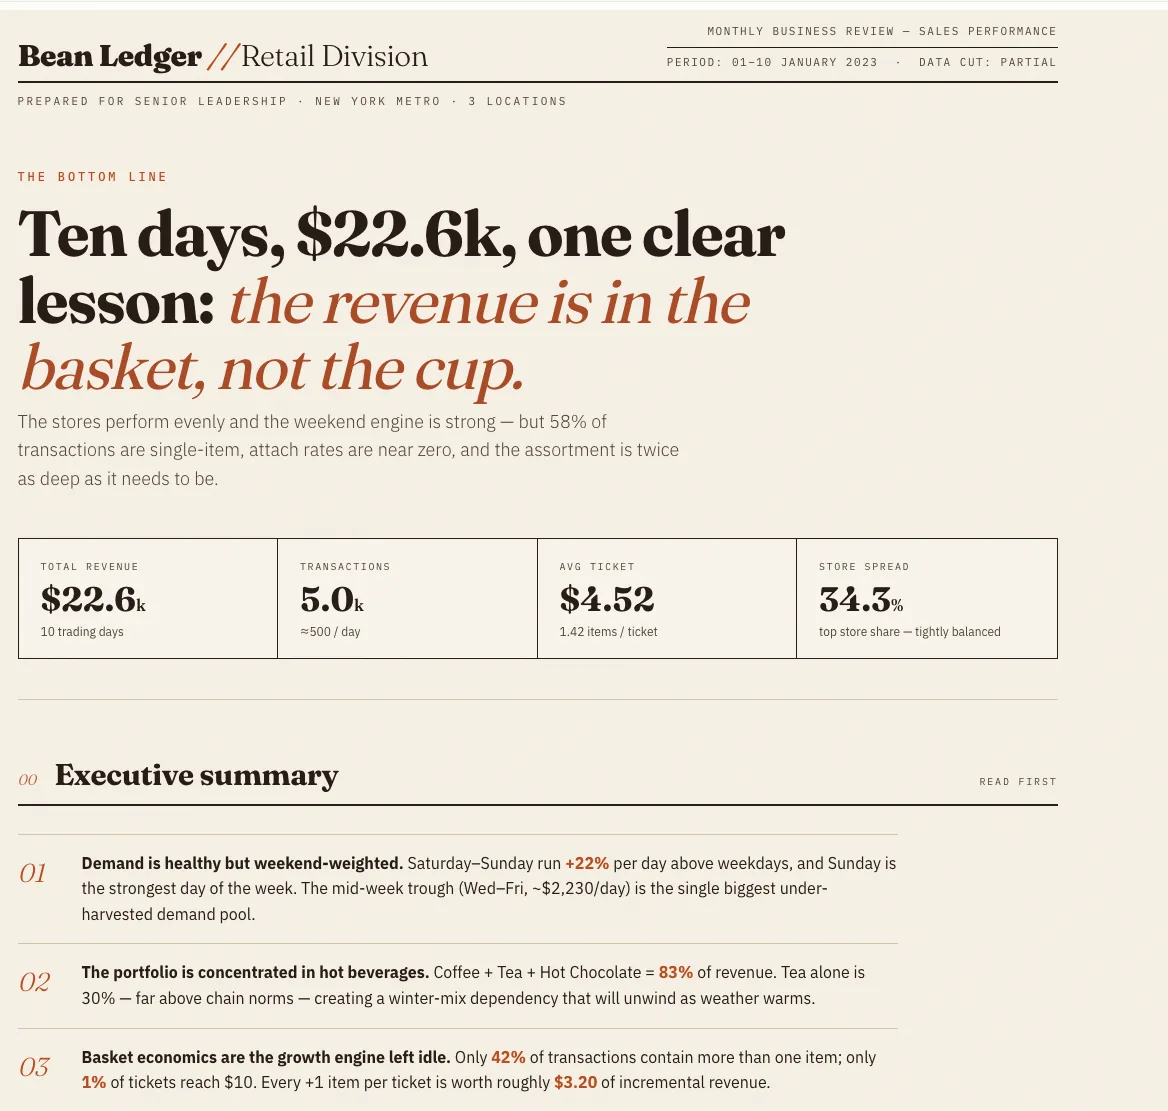
Track sales, inventory, store, and customer KPIs, and build a dashboard from spreadsheet exports.
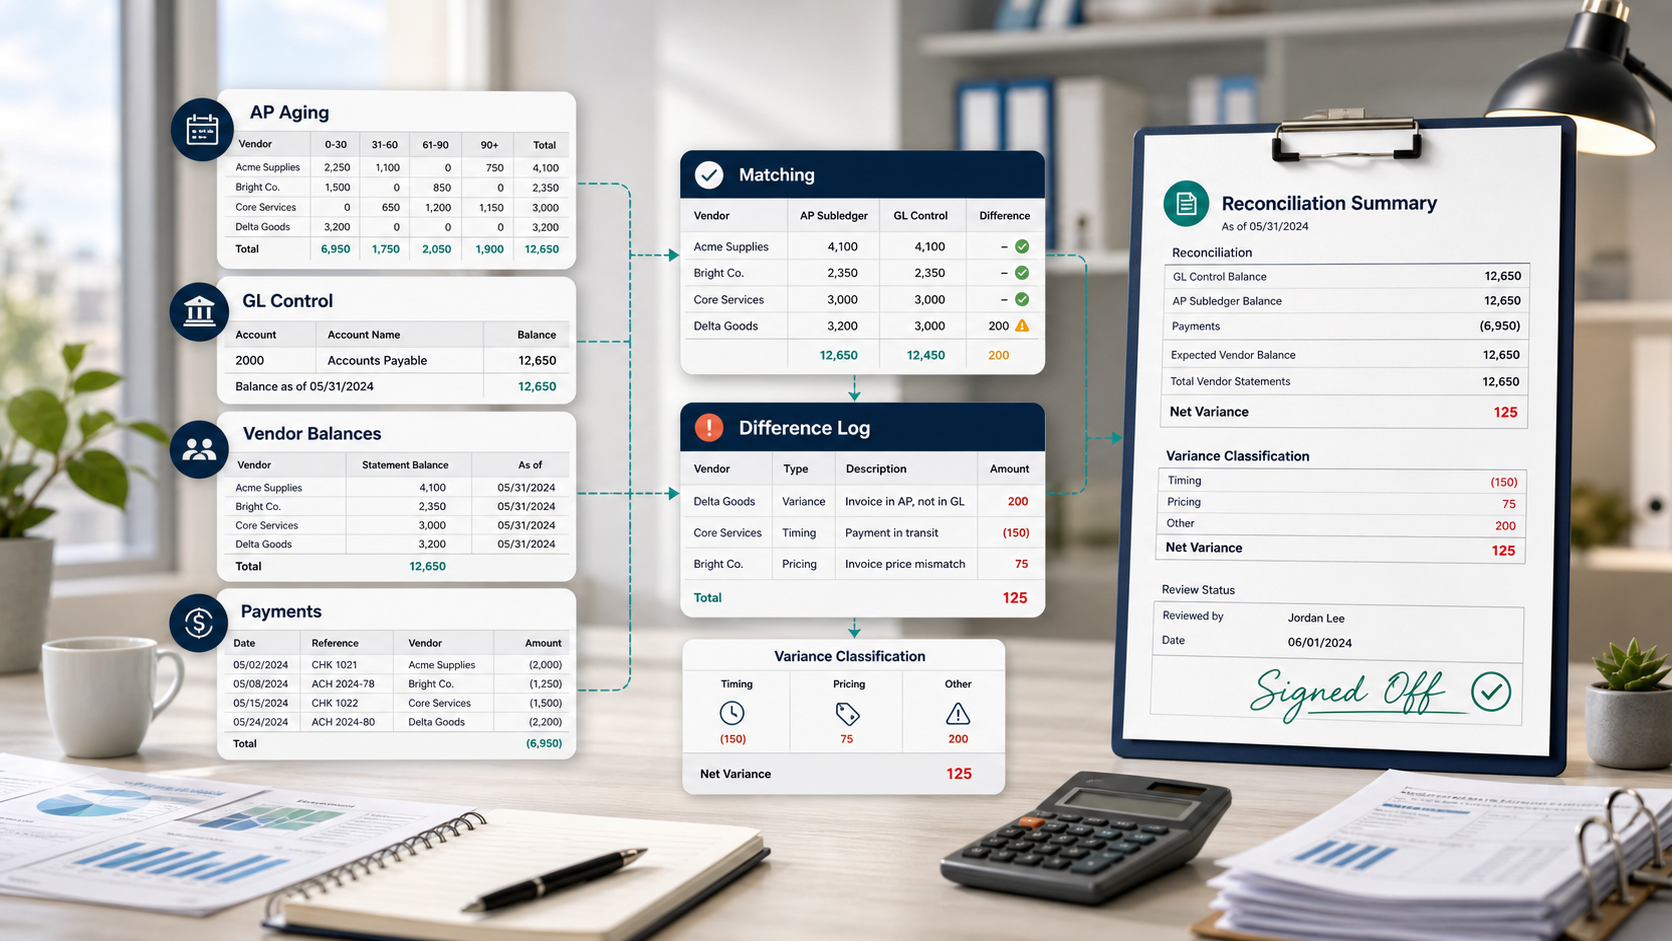
Compare AP aging, vendor records, payments, and the GL control account before close.
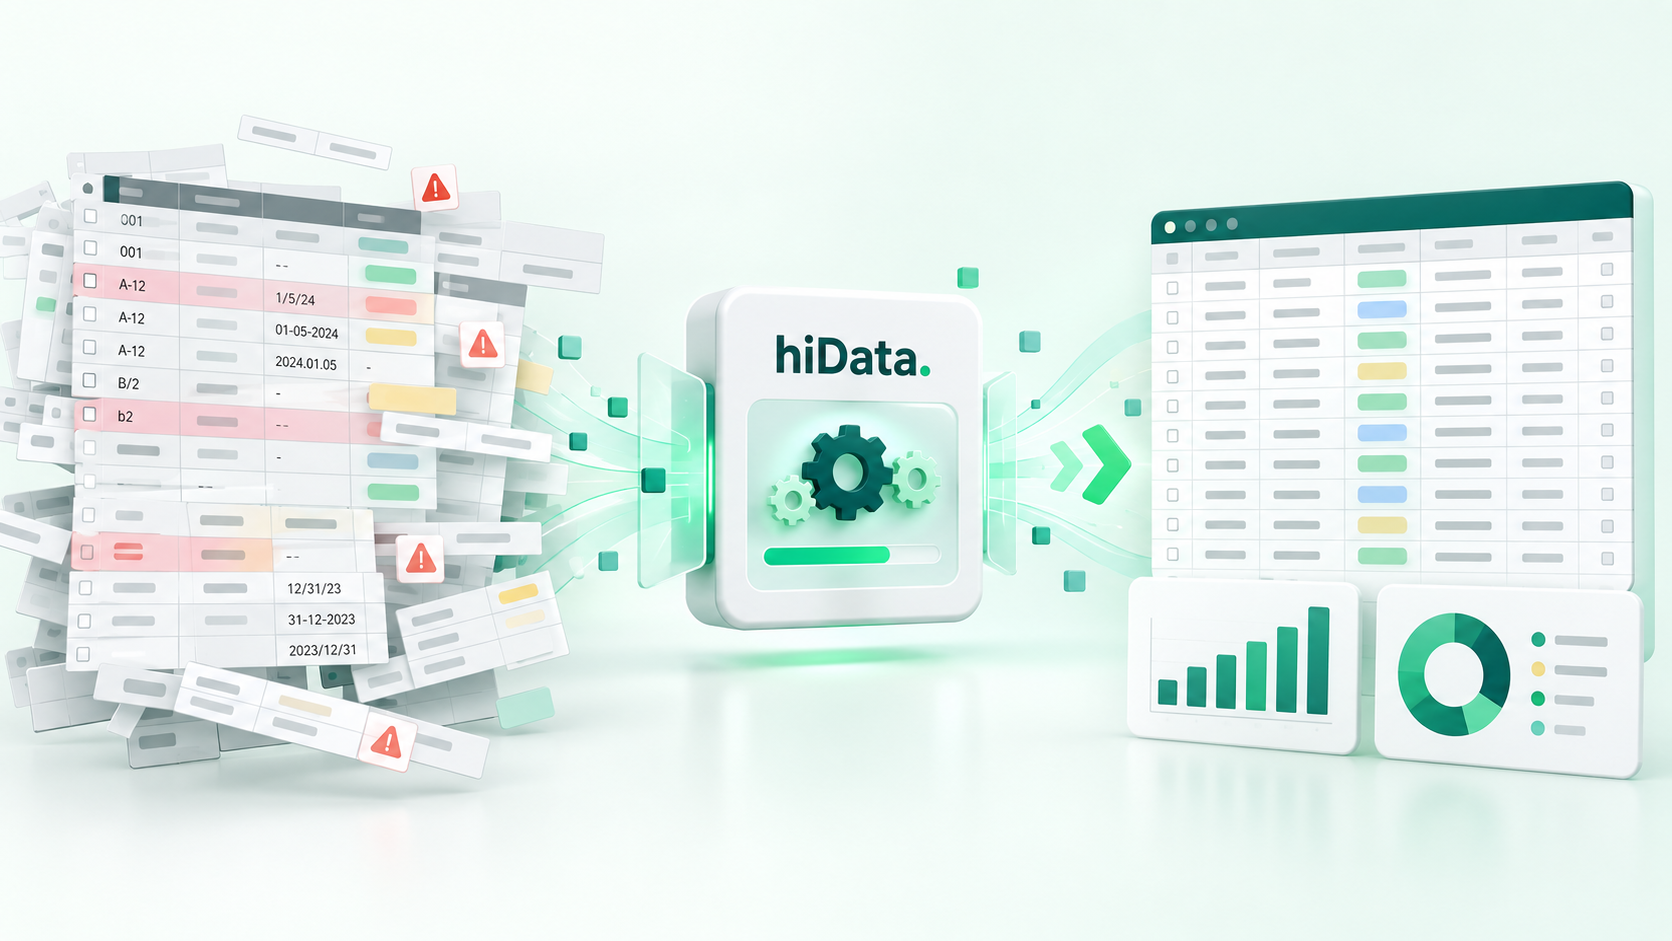
Turn messy spreadsheet exports into reliable, analysis-ready tables without hiding uncertainty.
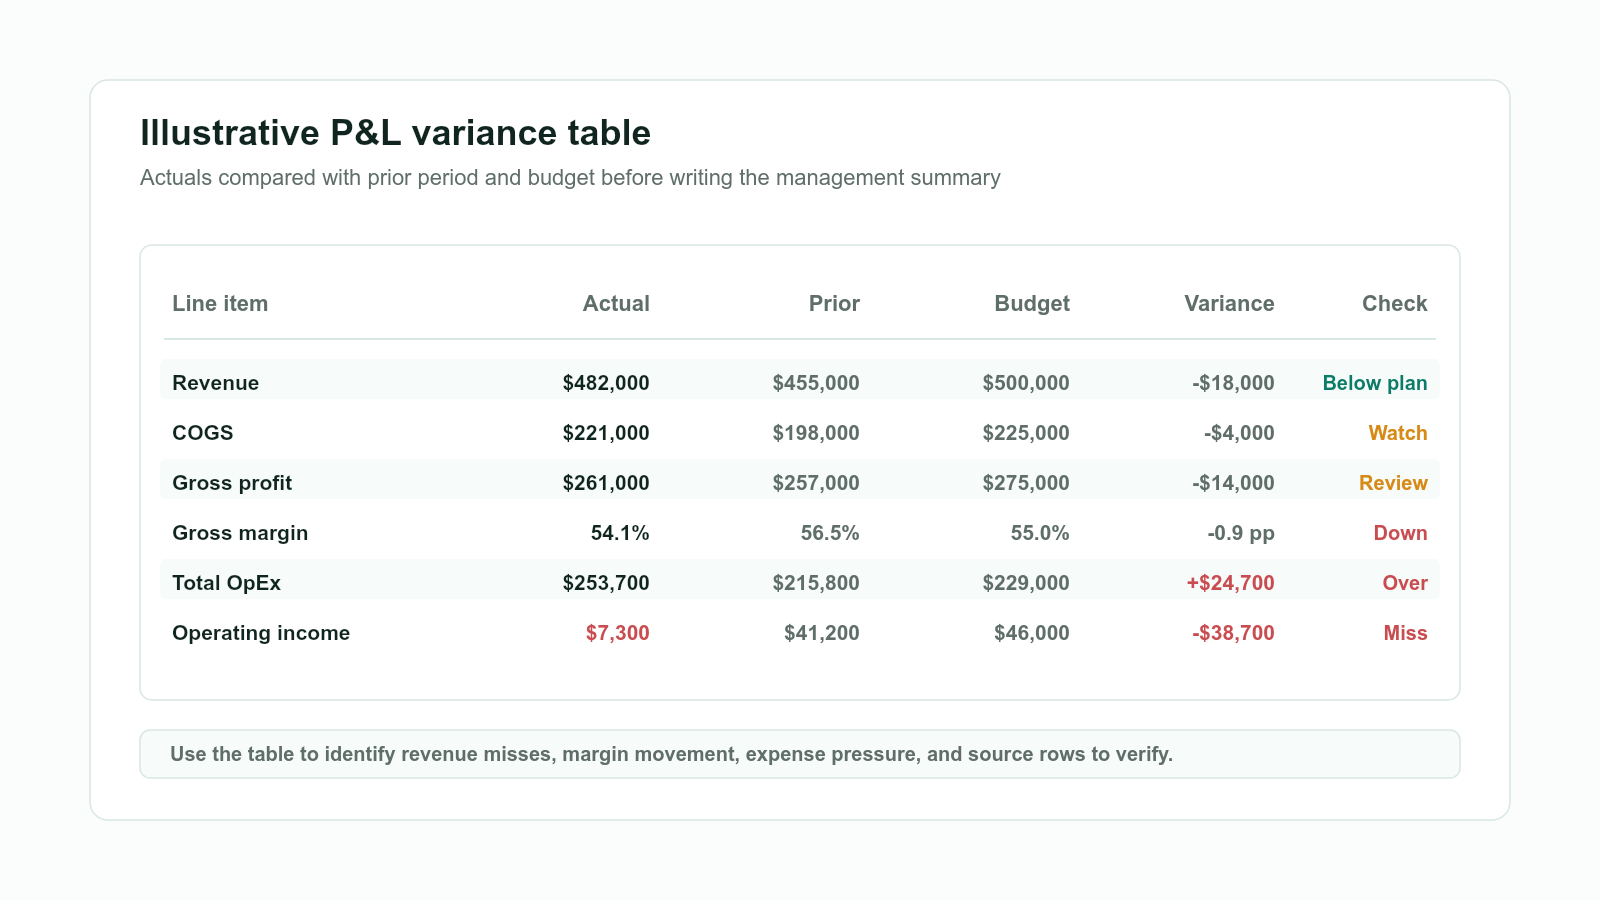
Review revenue, margins, expenses, and variances in Excel, then draft a traceable management summary.
Compare linked charts, scripts, and AI workflows for turning spreadsheet data into reliable presentations.
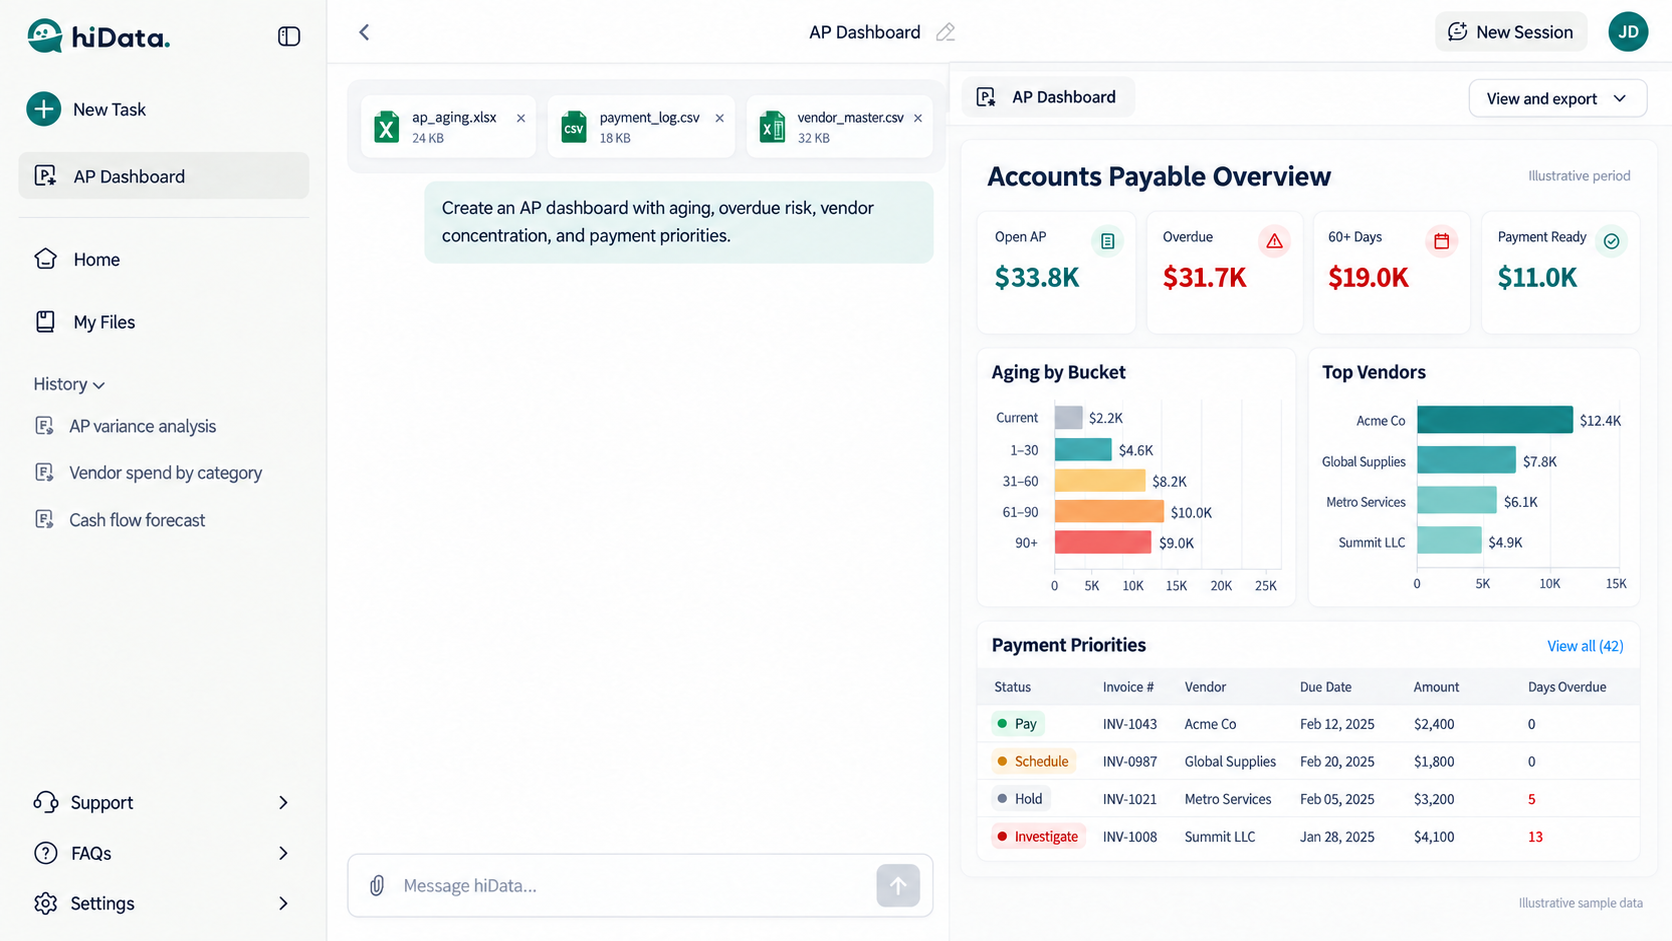
Turn AP exports into aging KPIs, vendor exposure, and a reviewable payment-priority queue.
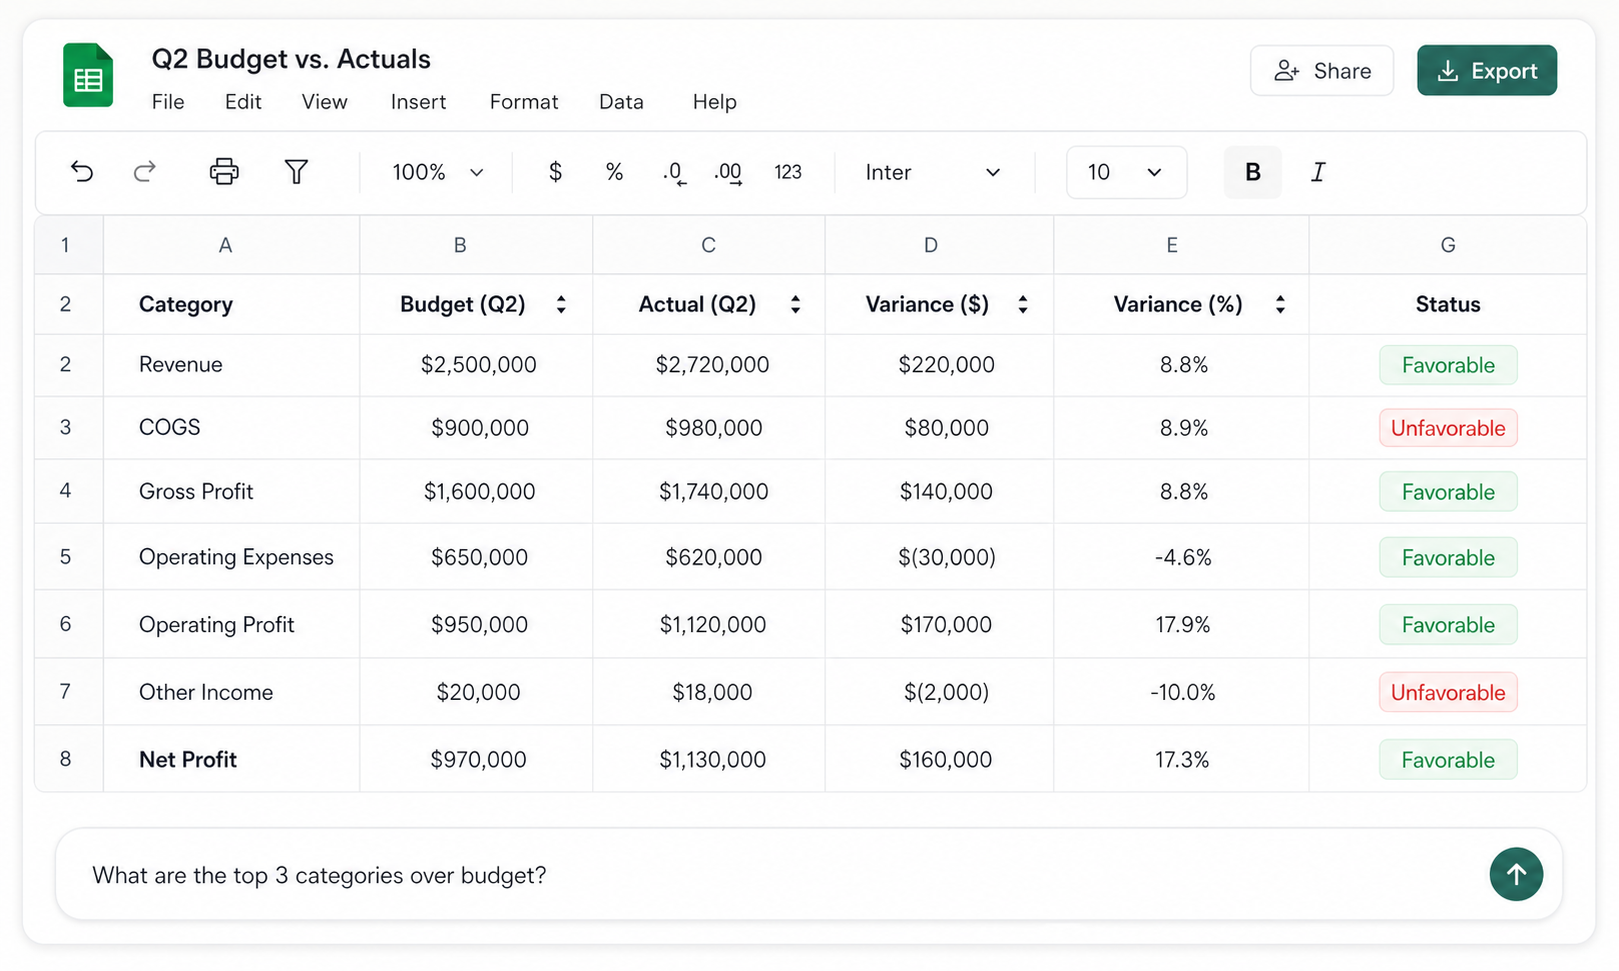
Compare budget versus actual results, classify variances, and trace material gaps to reviewable drivers.
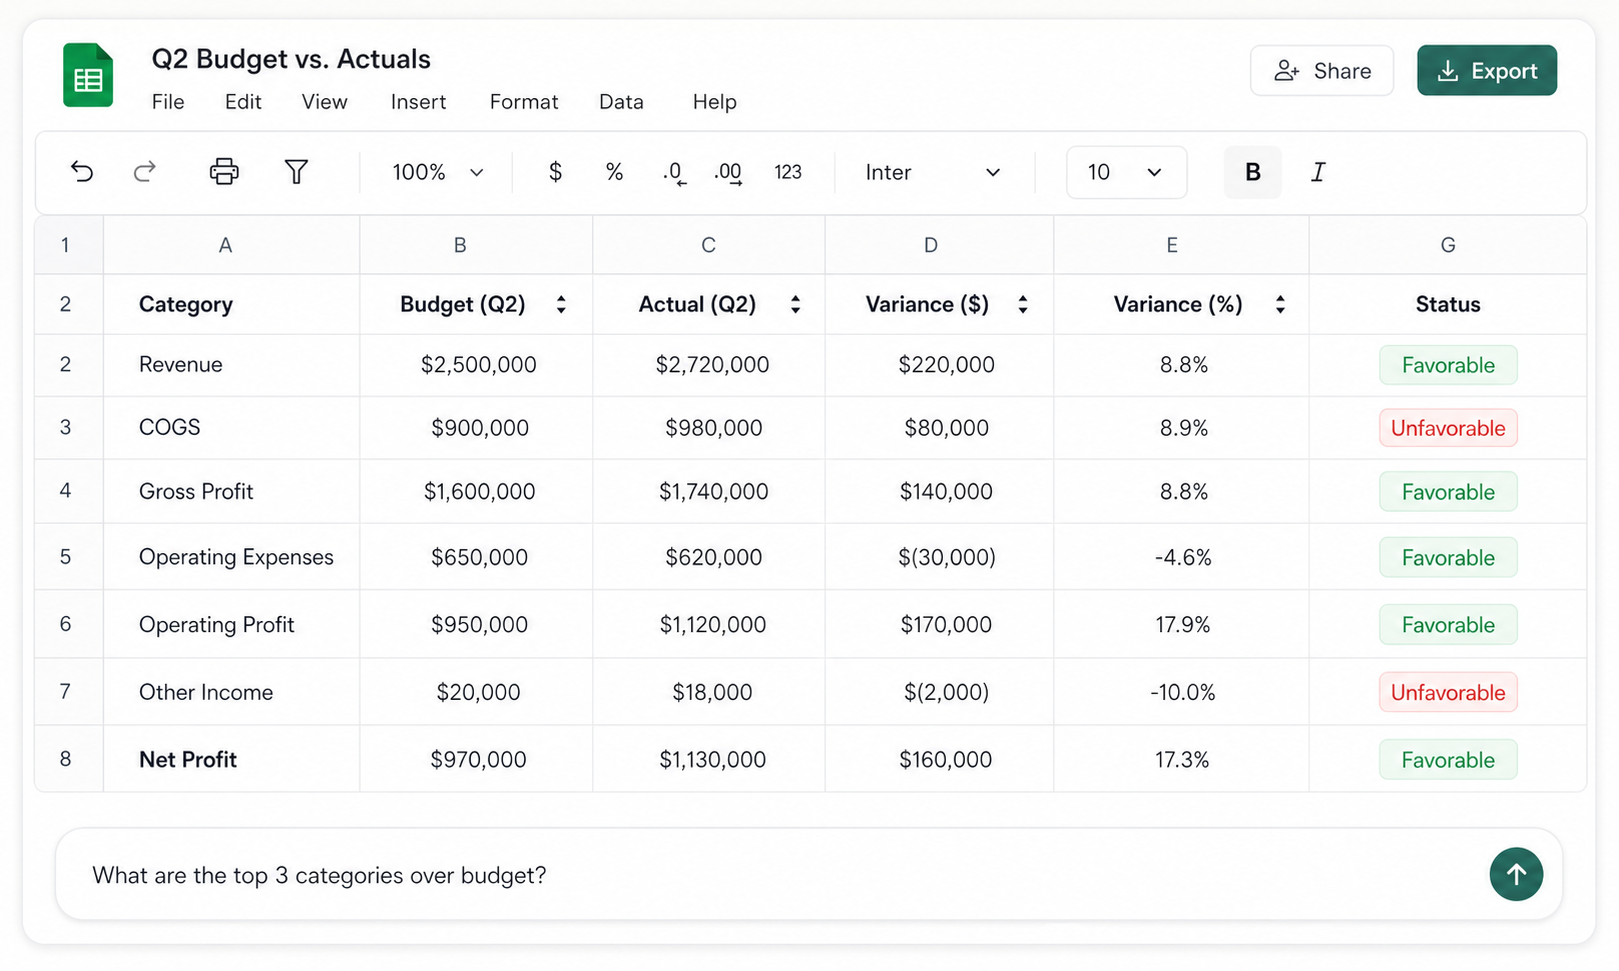
Use AI to prepare FP&A data, investigate variances, test scenarios, and draft reviewable management reporting.
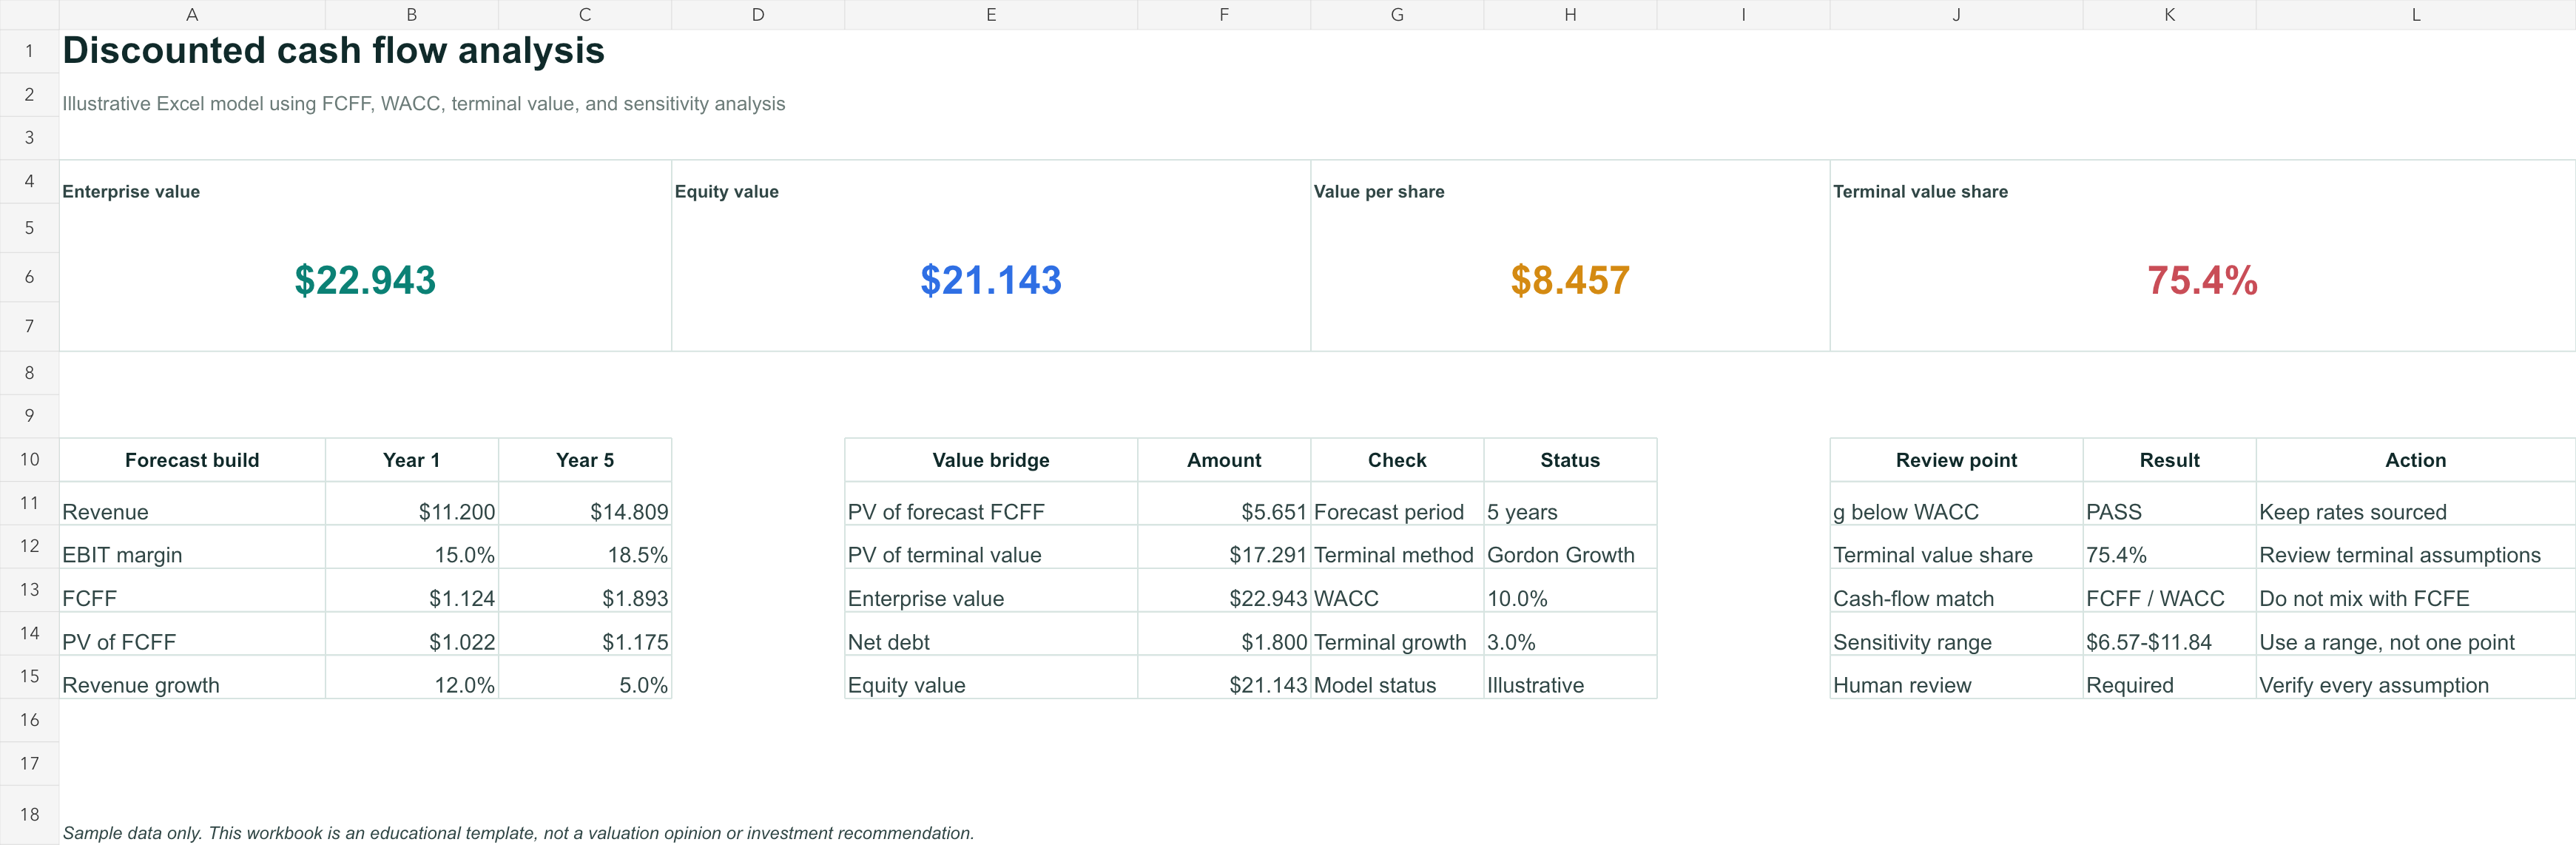
Build an Excel DCF with FCFF, WACC, terminal value, sensitivity analysis, and a worked valuation example.
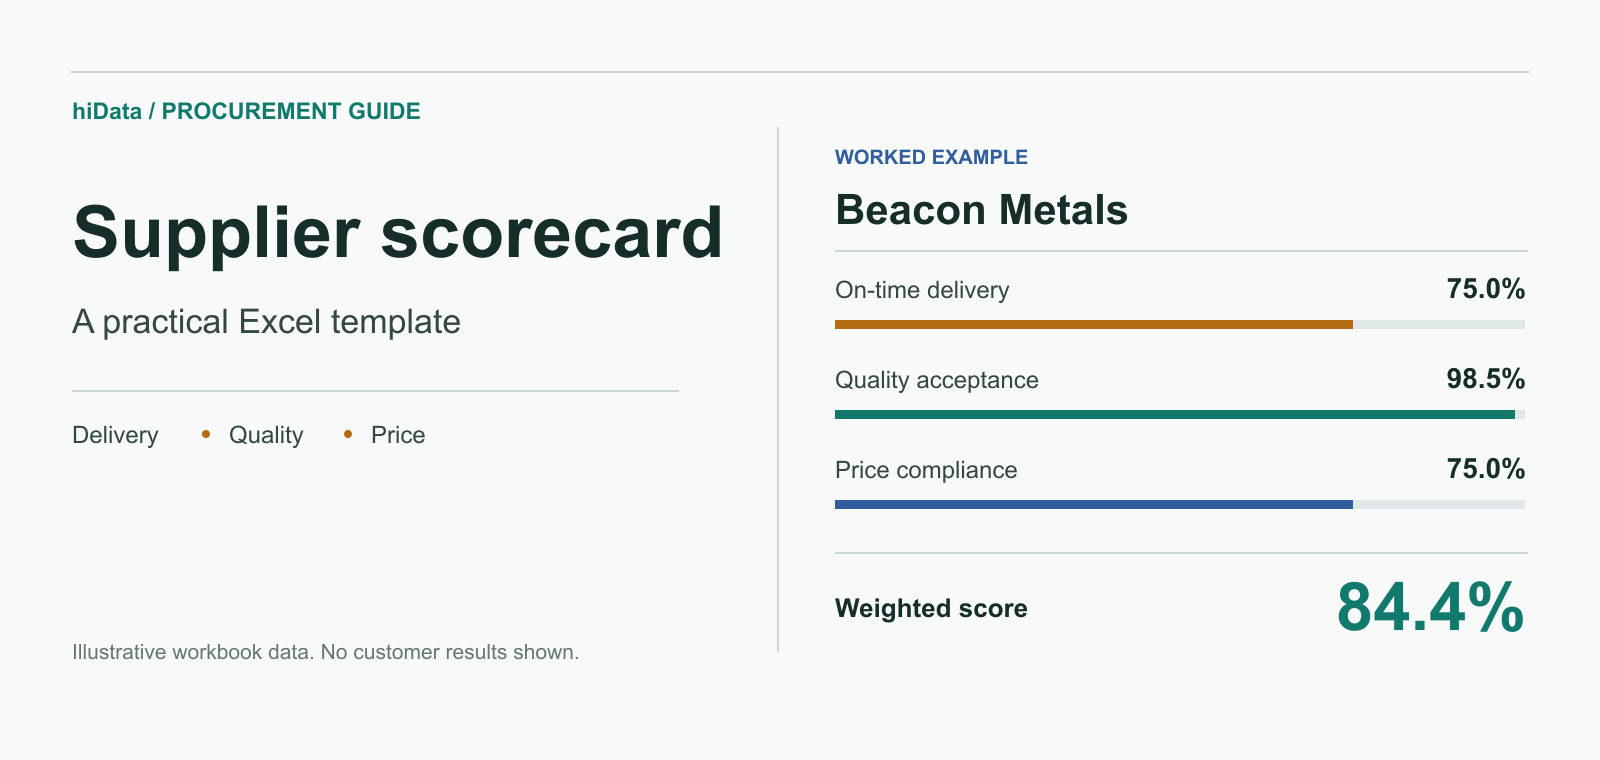
Download an Excel supplier scorecard with delivery, quality, price compliance, and weighted KPI scoring.
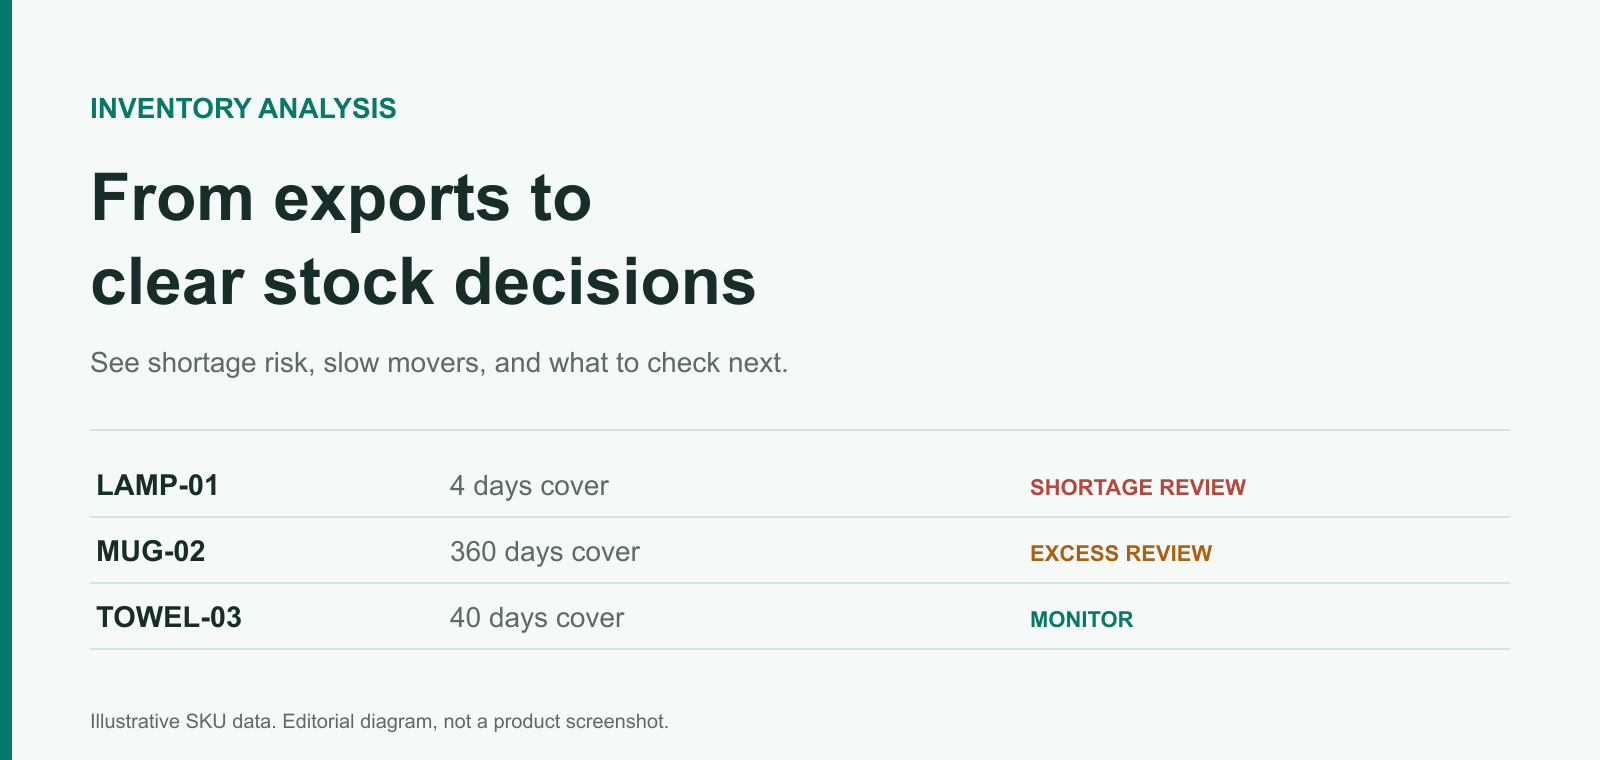
Analyze SKU-level stock and sales exports to identify shortages, excess inventory, and reorder priorities.

Compare ten AI spreadsheet tools by workbook editing, data cleaning, formulas, analysis, and dashboard workflow.
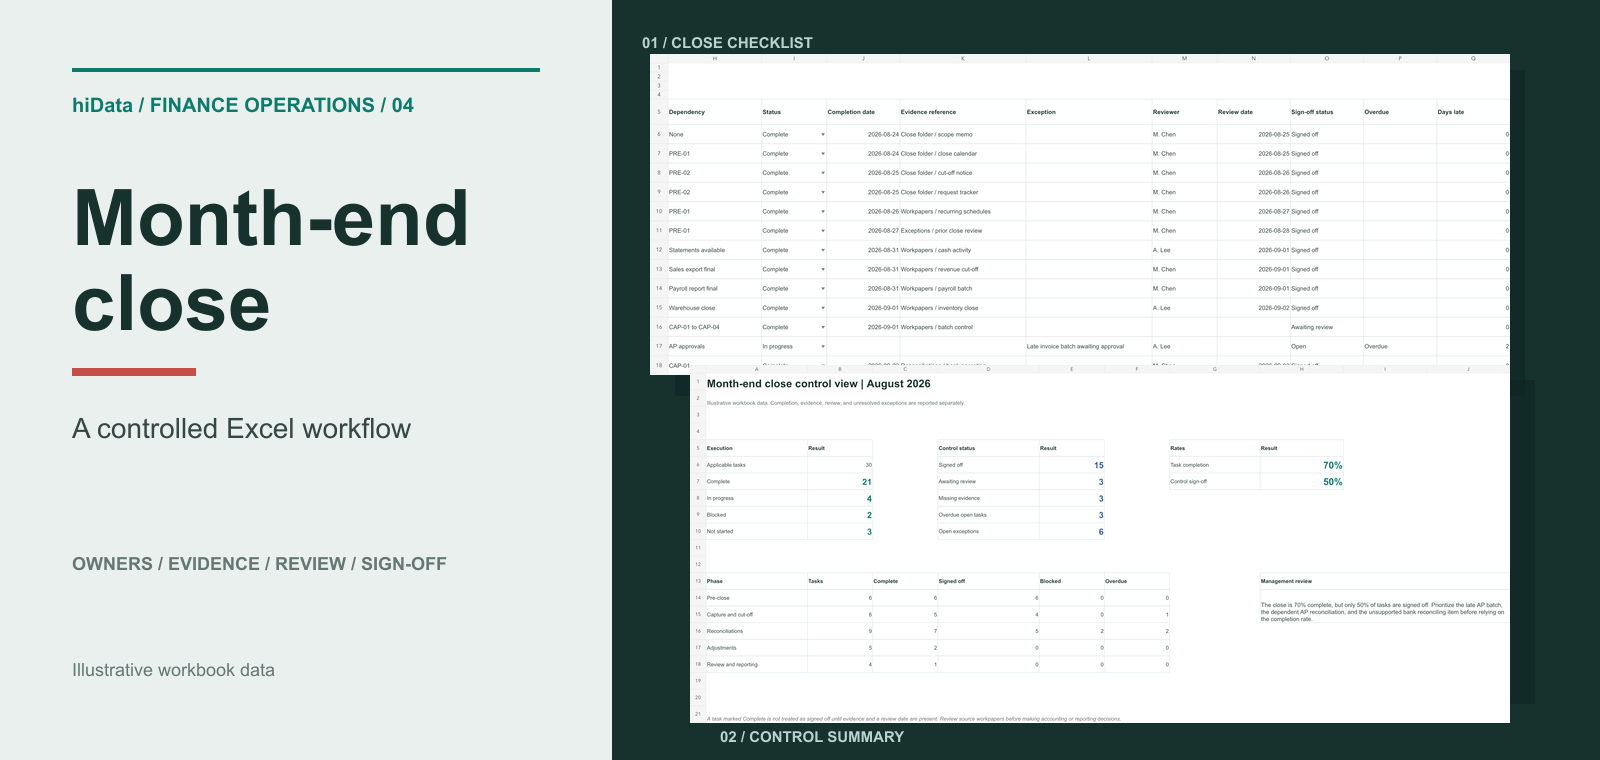
Build a controlled Excel close checklist with owners, dependencies, evidence, reviewer sign-off, and a free template.
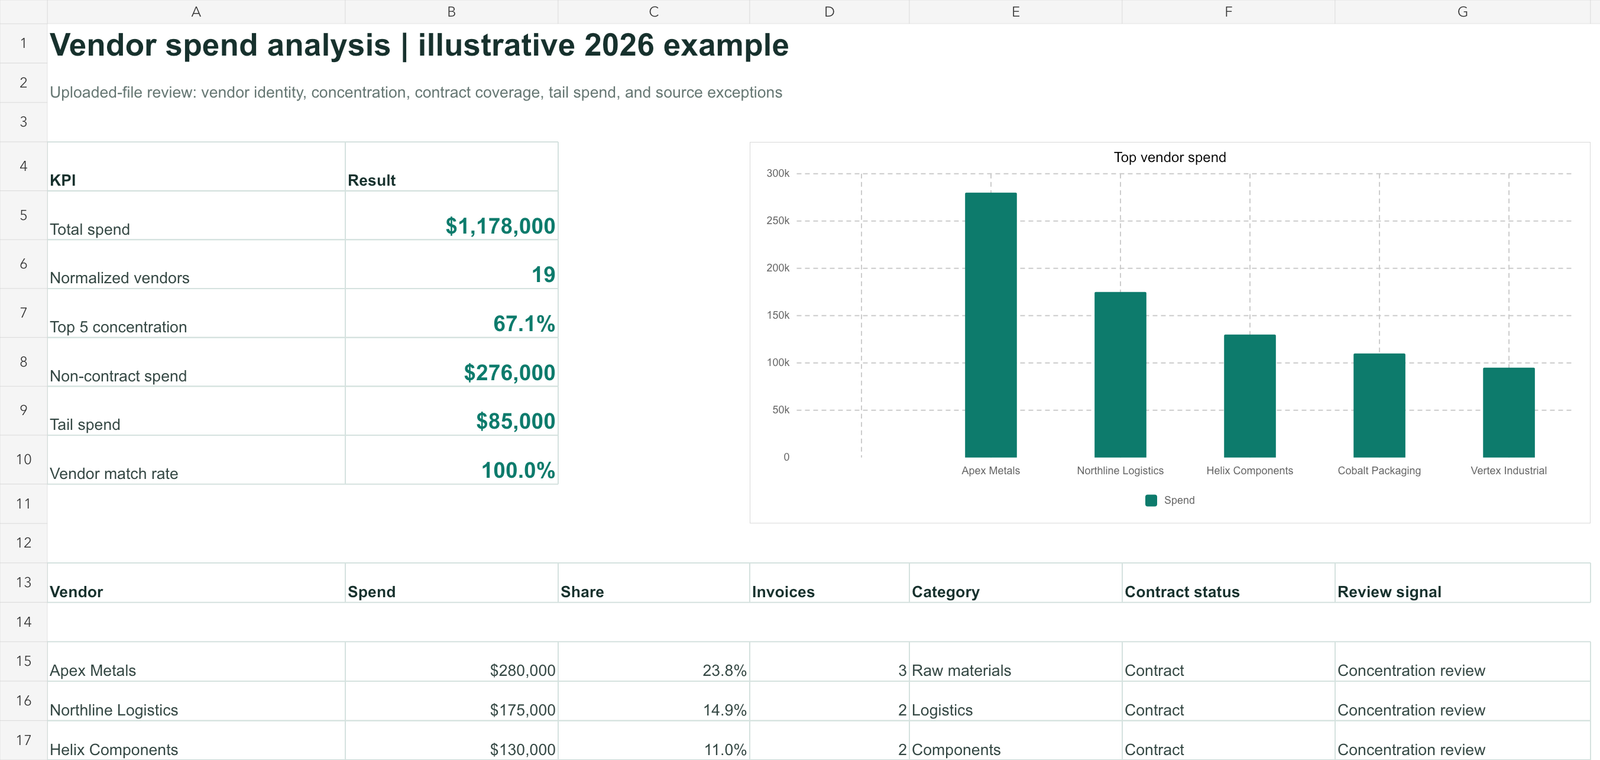
Analyze supplier spend from Excel exports with clean vendor mappings, KPIs, exceptions, and a free template.
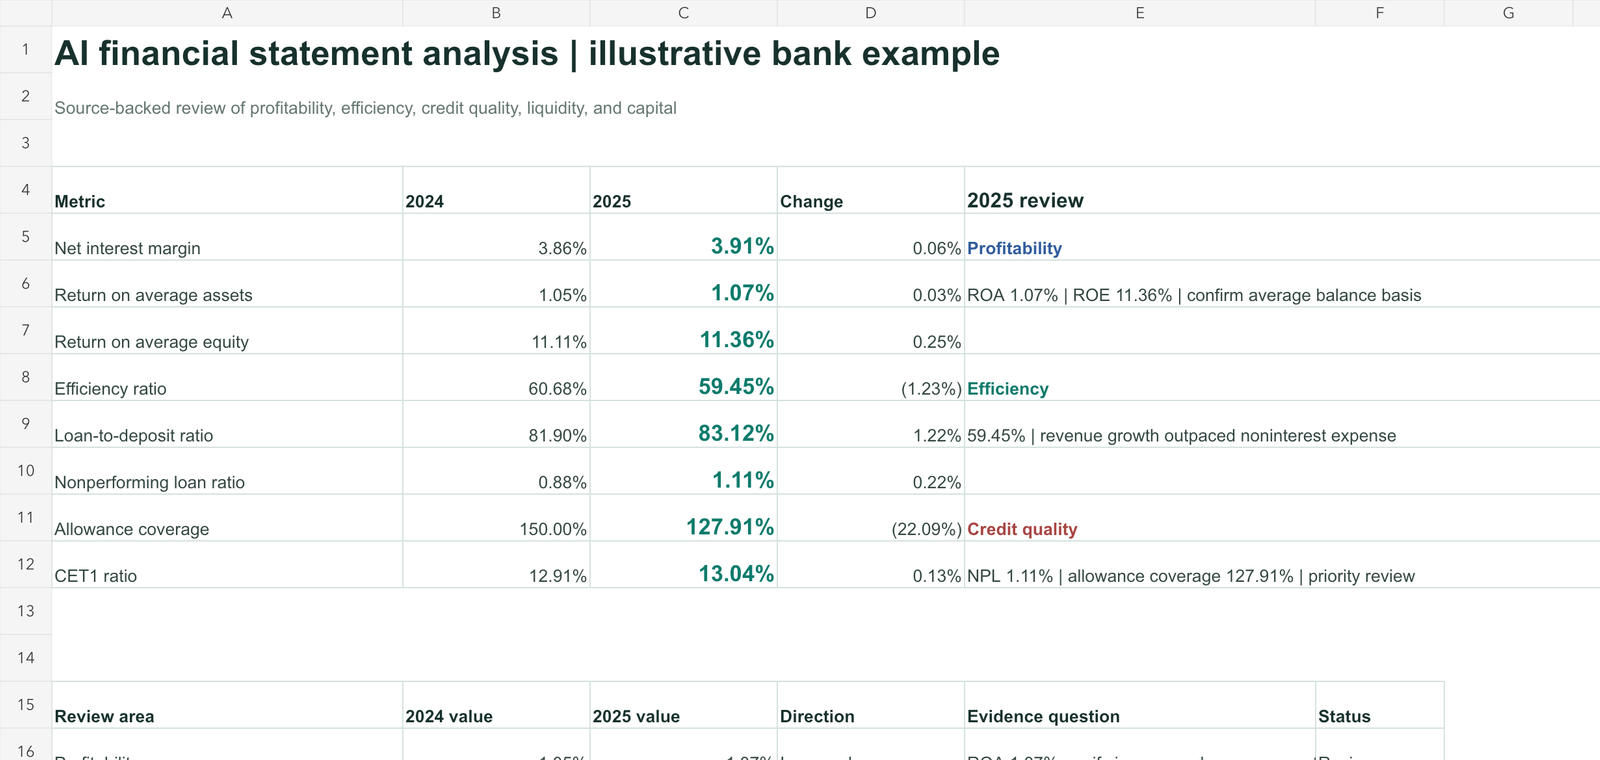
Analyze financial statements in Excel with traceable ratios, SEC filing exports, and a free bank example template.
Compare Excel AI tools for audit and finance by file workflow, reconciliation, exceptions, reporting, and review needs.
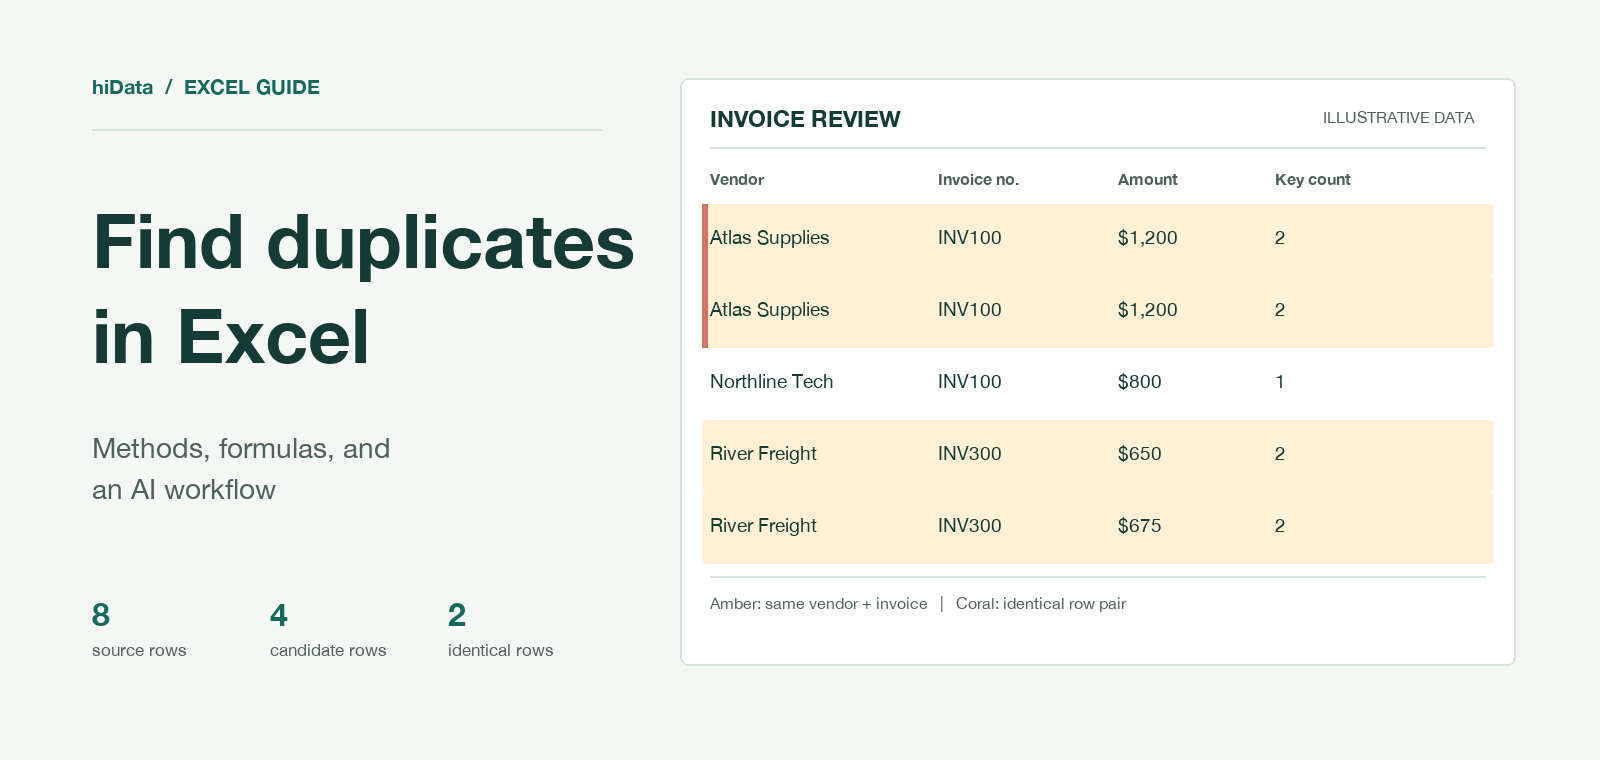
Find repeated values, compare invoice keys, and build a duplicate review list with Excel formulas and downloadable samples.
Build a repeatable monthly financial reporting process with approved files, reusable mappings, fixed templates, reconciliations, and clear exception handling.
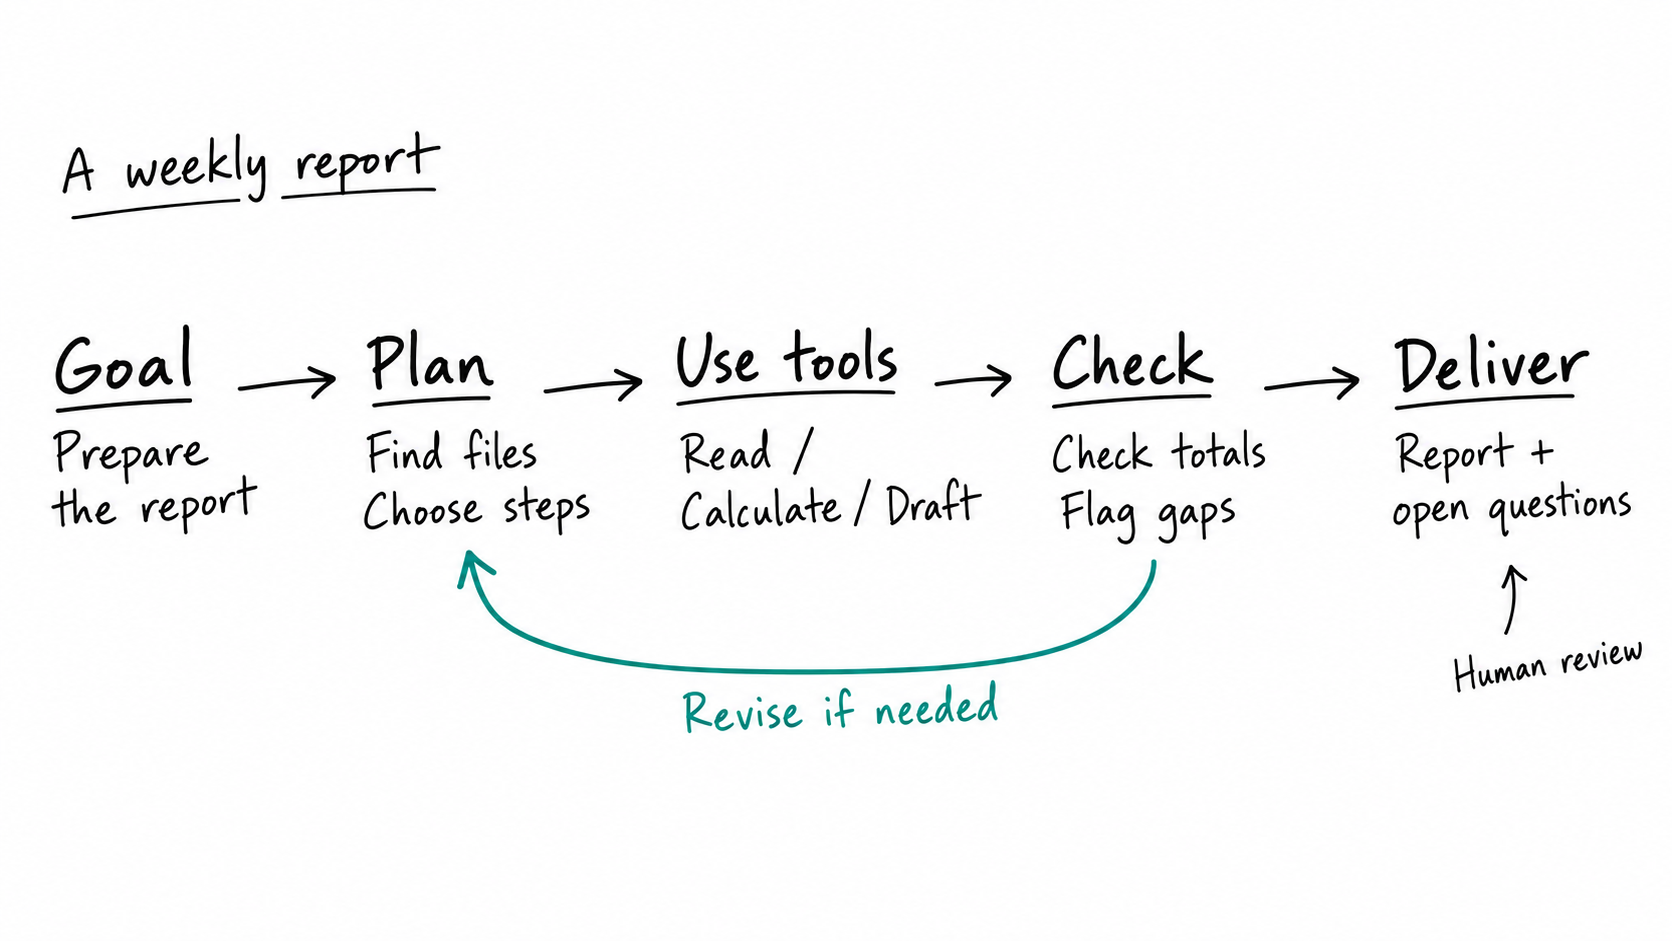
See how agentic AI connects file processing, transaction checks, receipt classification, and report preparation through a three-spreadsheet example. Learn where local deployment fits and how to choose a first workflow for a small team.
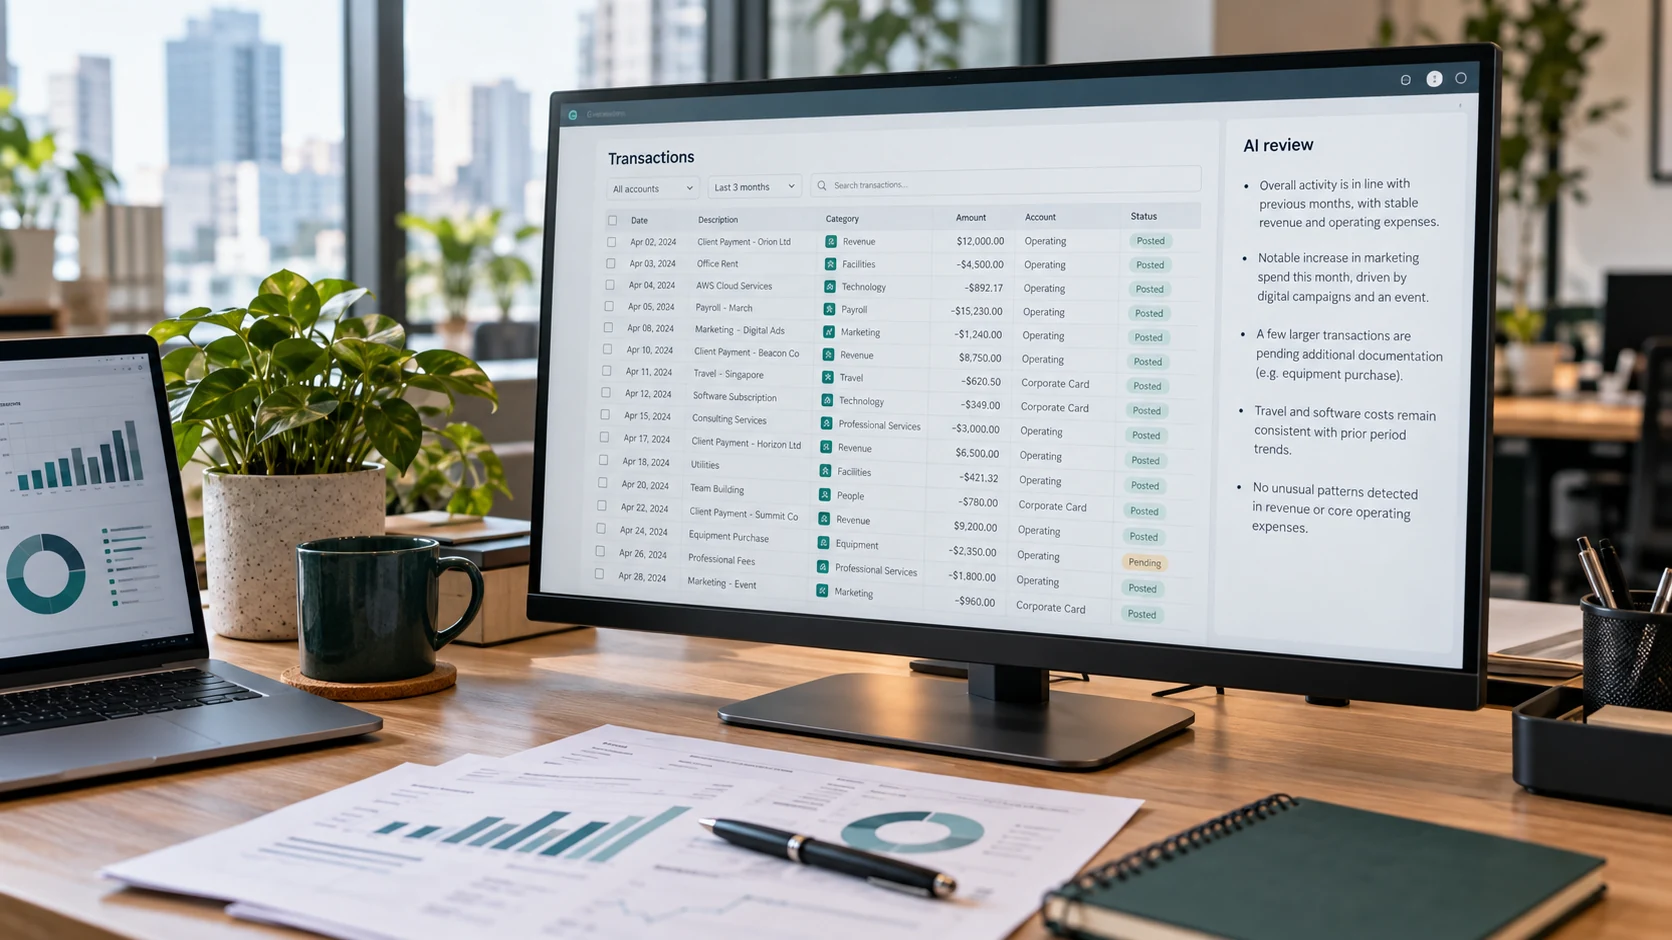
Learn where AI can help accounting and finance teams, what people still need to review, and how hiData turns financial files into practical workflows.

Use consistent spacing, alignment, readable typography, and practical prompts to review and improve AI-generated business slides.
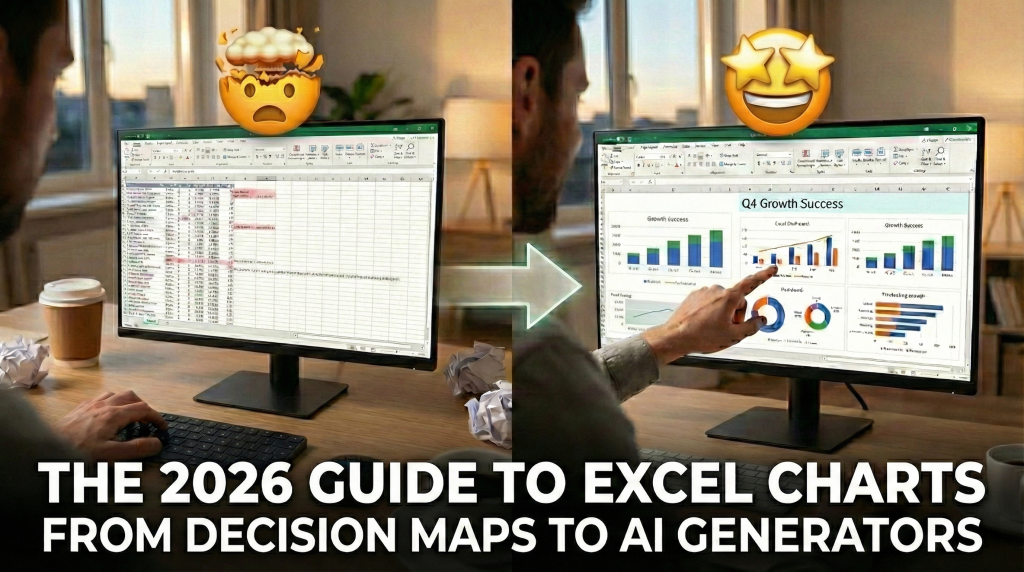
Choose the right Excel chart for trends, comparisons, distributions, and relationships, then verify the data and AI-generated visual.
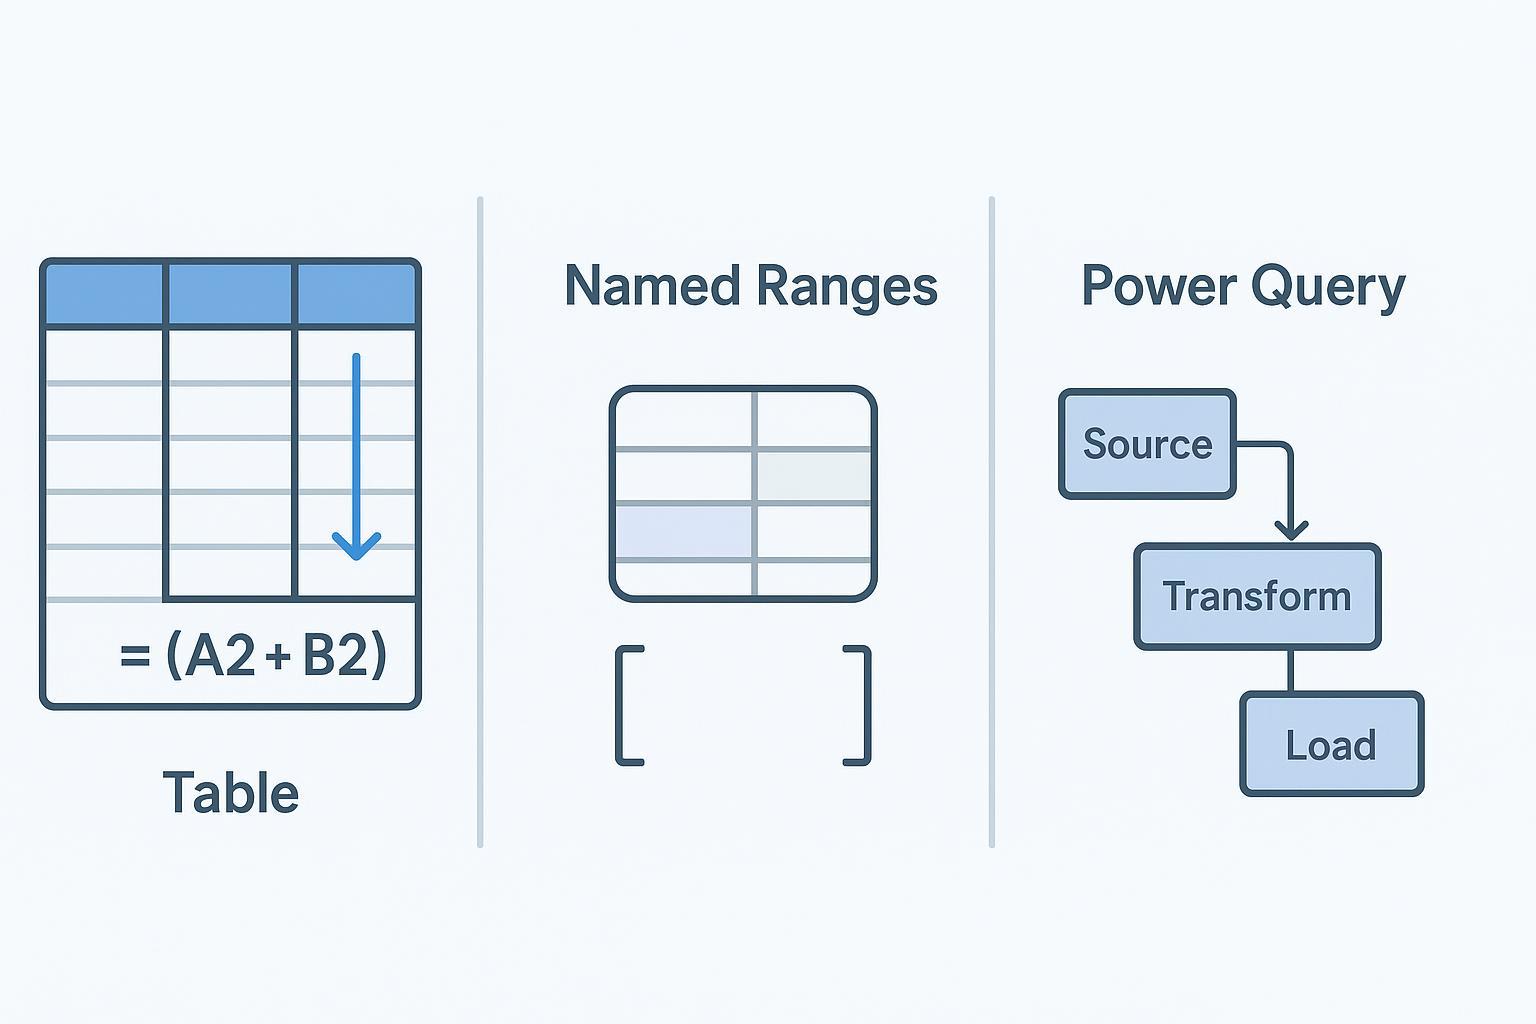
Choose Excel Tables for expanding worksheet data, Named Ranges for reusable inputs, and Power Query for repeatable cleanup and reporting.
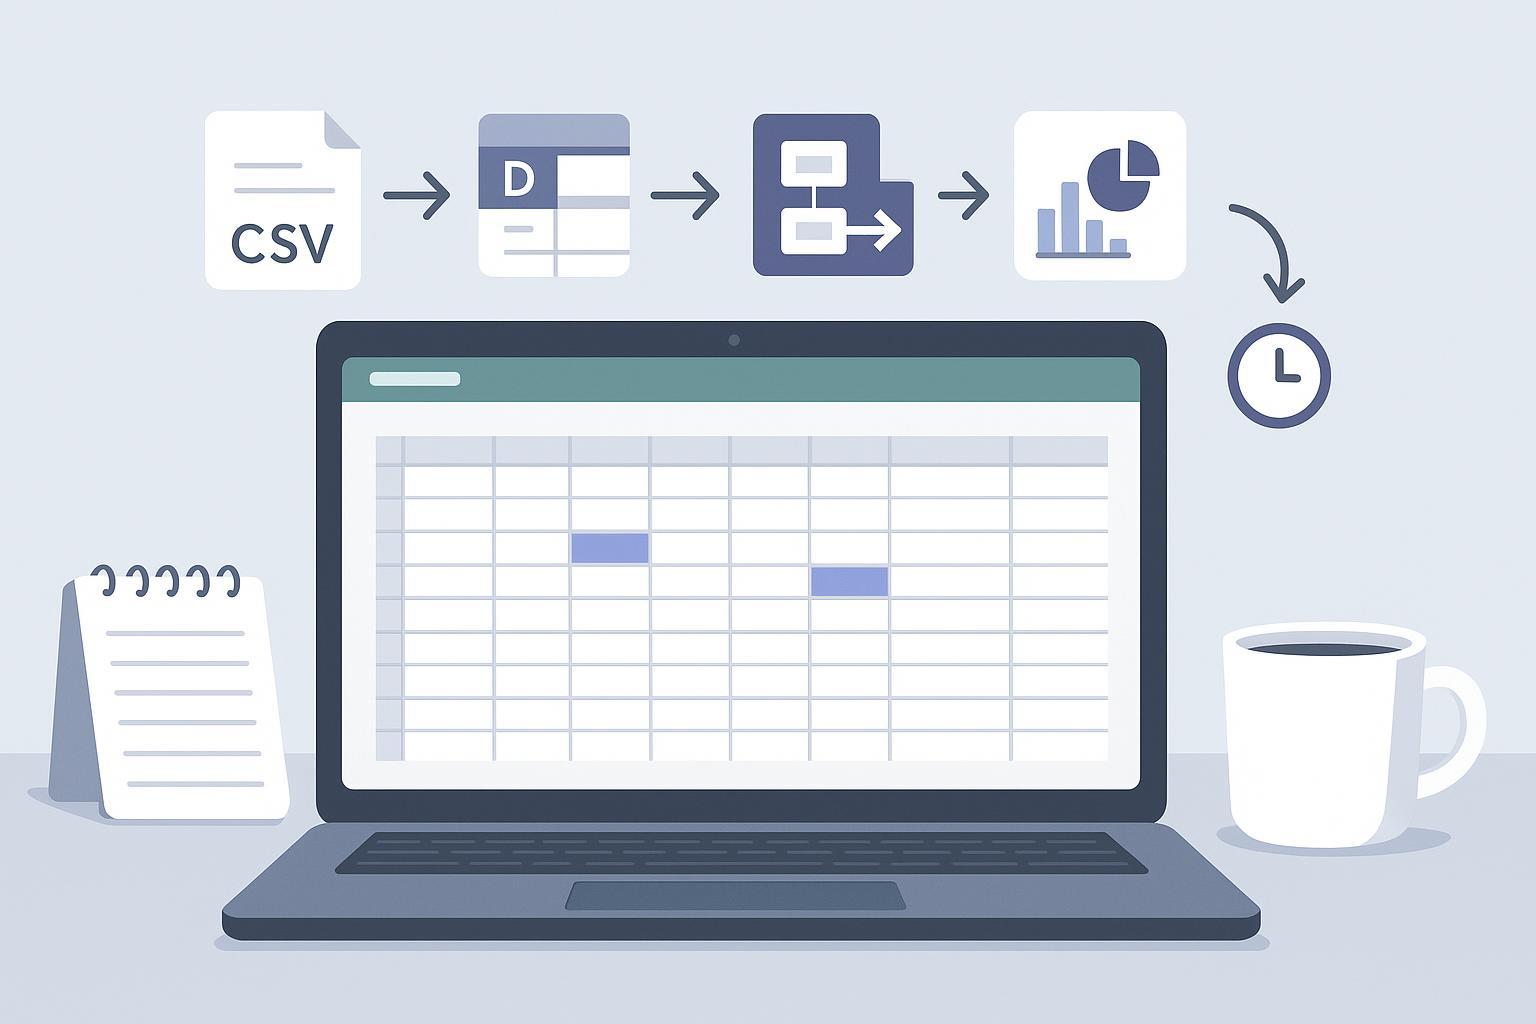
Use an orders CSV to build a repeatable Excel cleanup and reporting workflow, with safe order-line deduplication, product joins, and refresh checks.
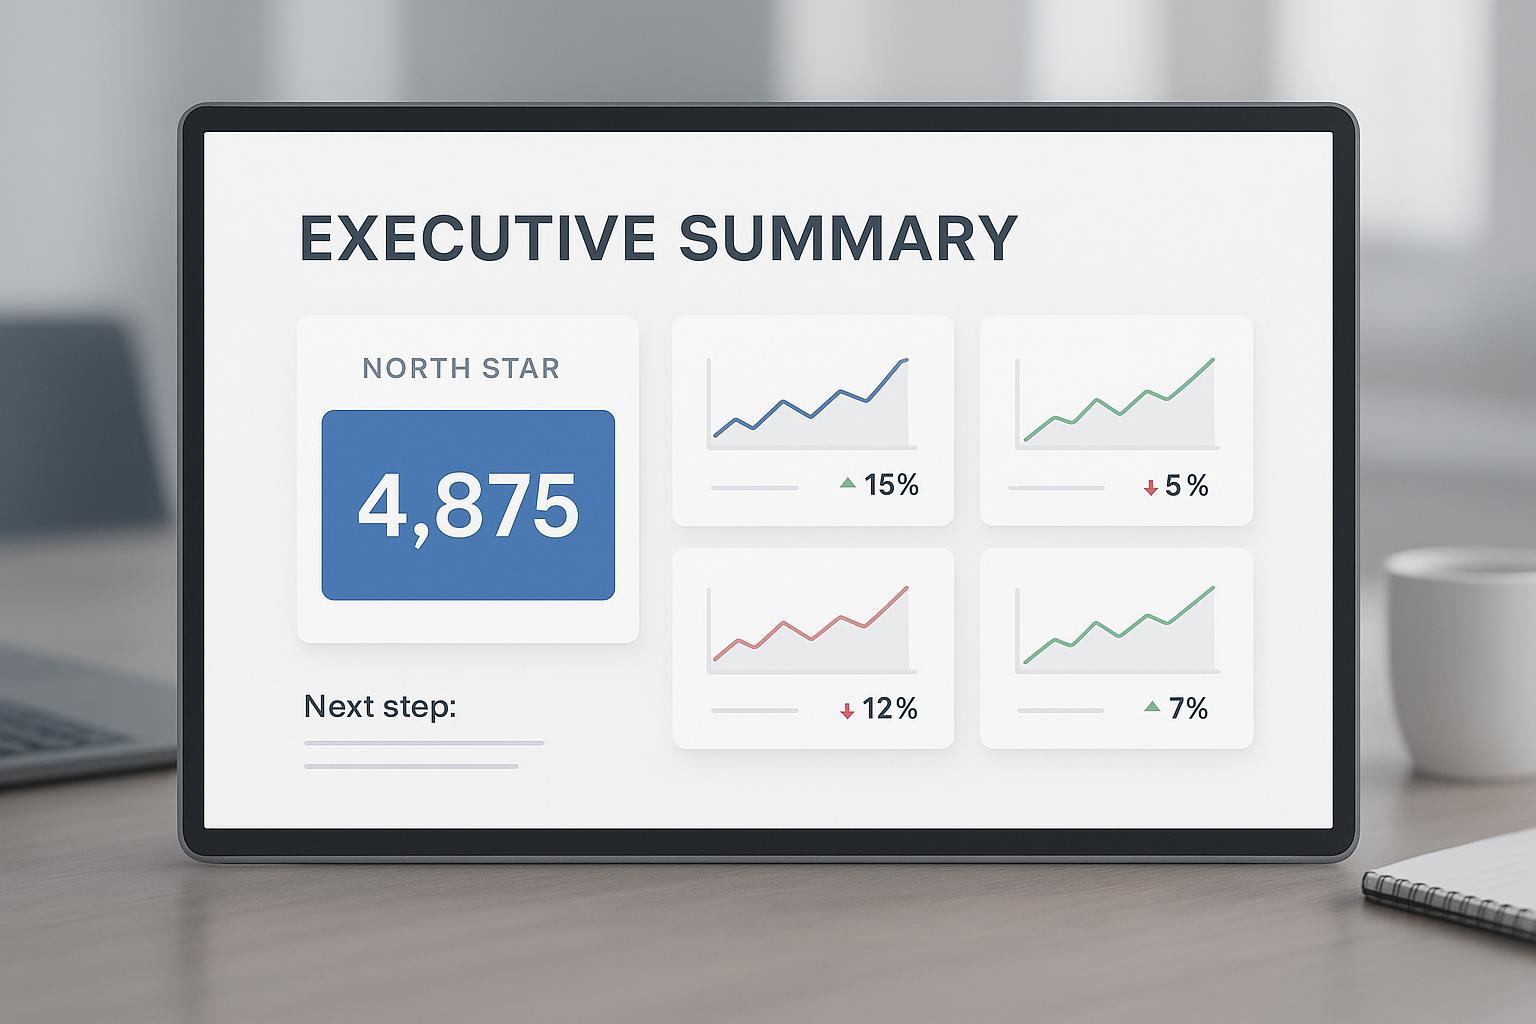
Turn a reviewed KPI table into a concise executive summary slide with reusable prompts, clear chart choices, and a source-checking checklist.
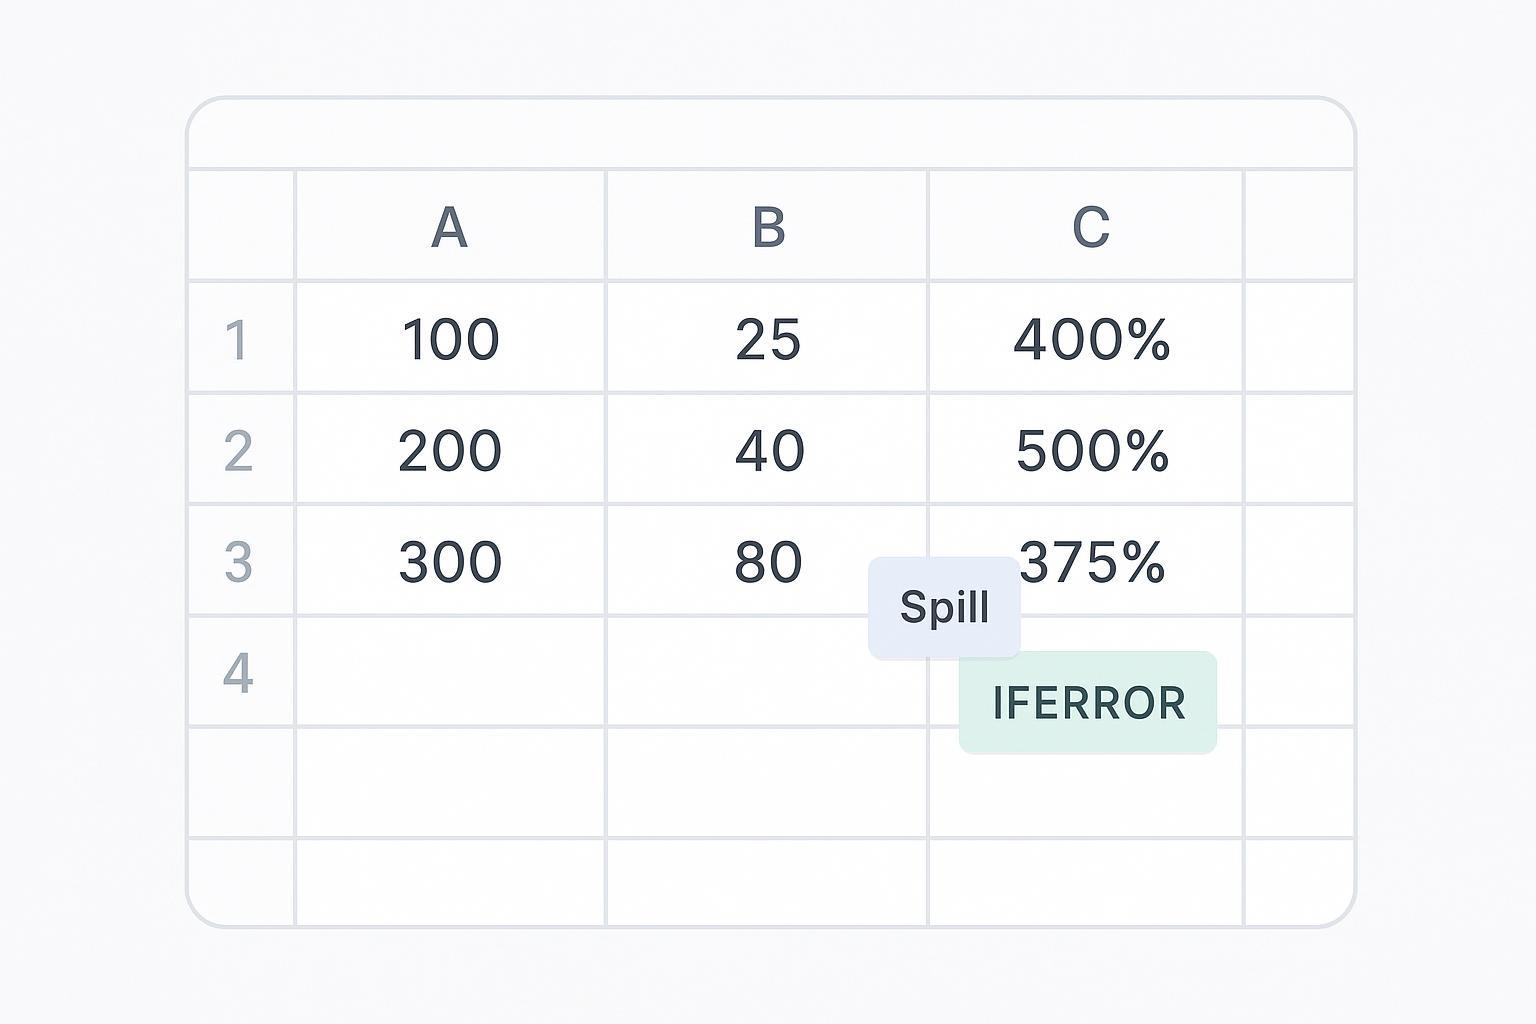
Compare three ways to divide Excel columns, handle invalid denominators, and produce clear percentage or decimal results.
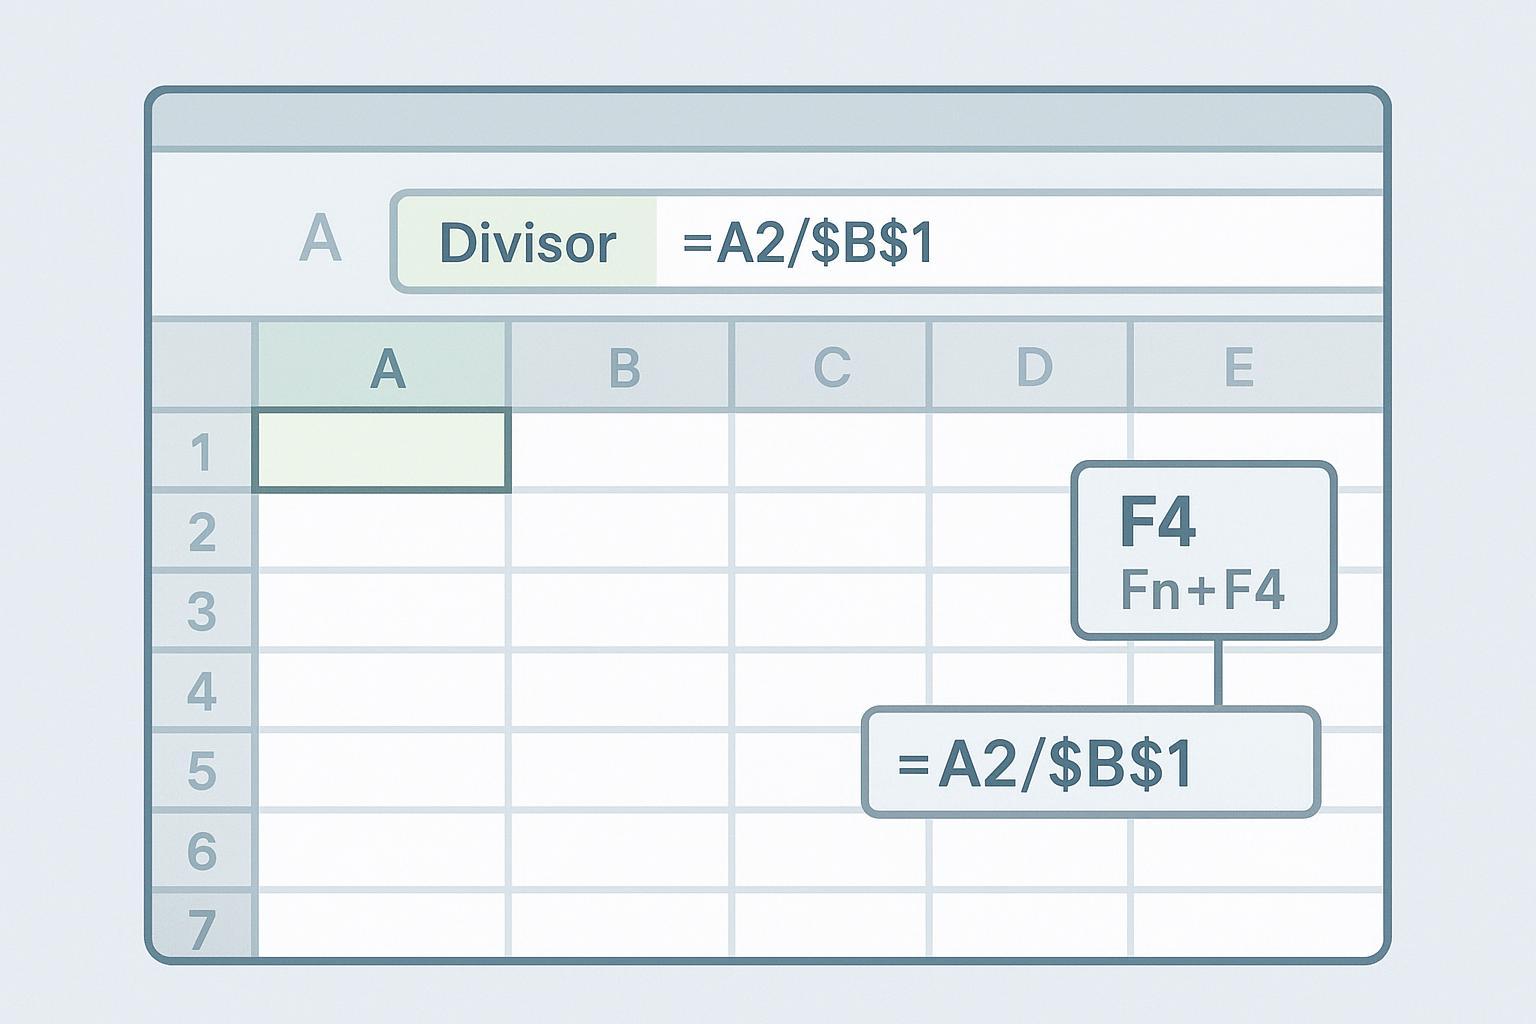
Use dollar signs, F4, and mixed references to keep Excel formulas pointing to the correct cells when copying down or across.
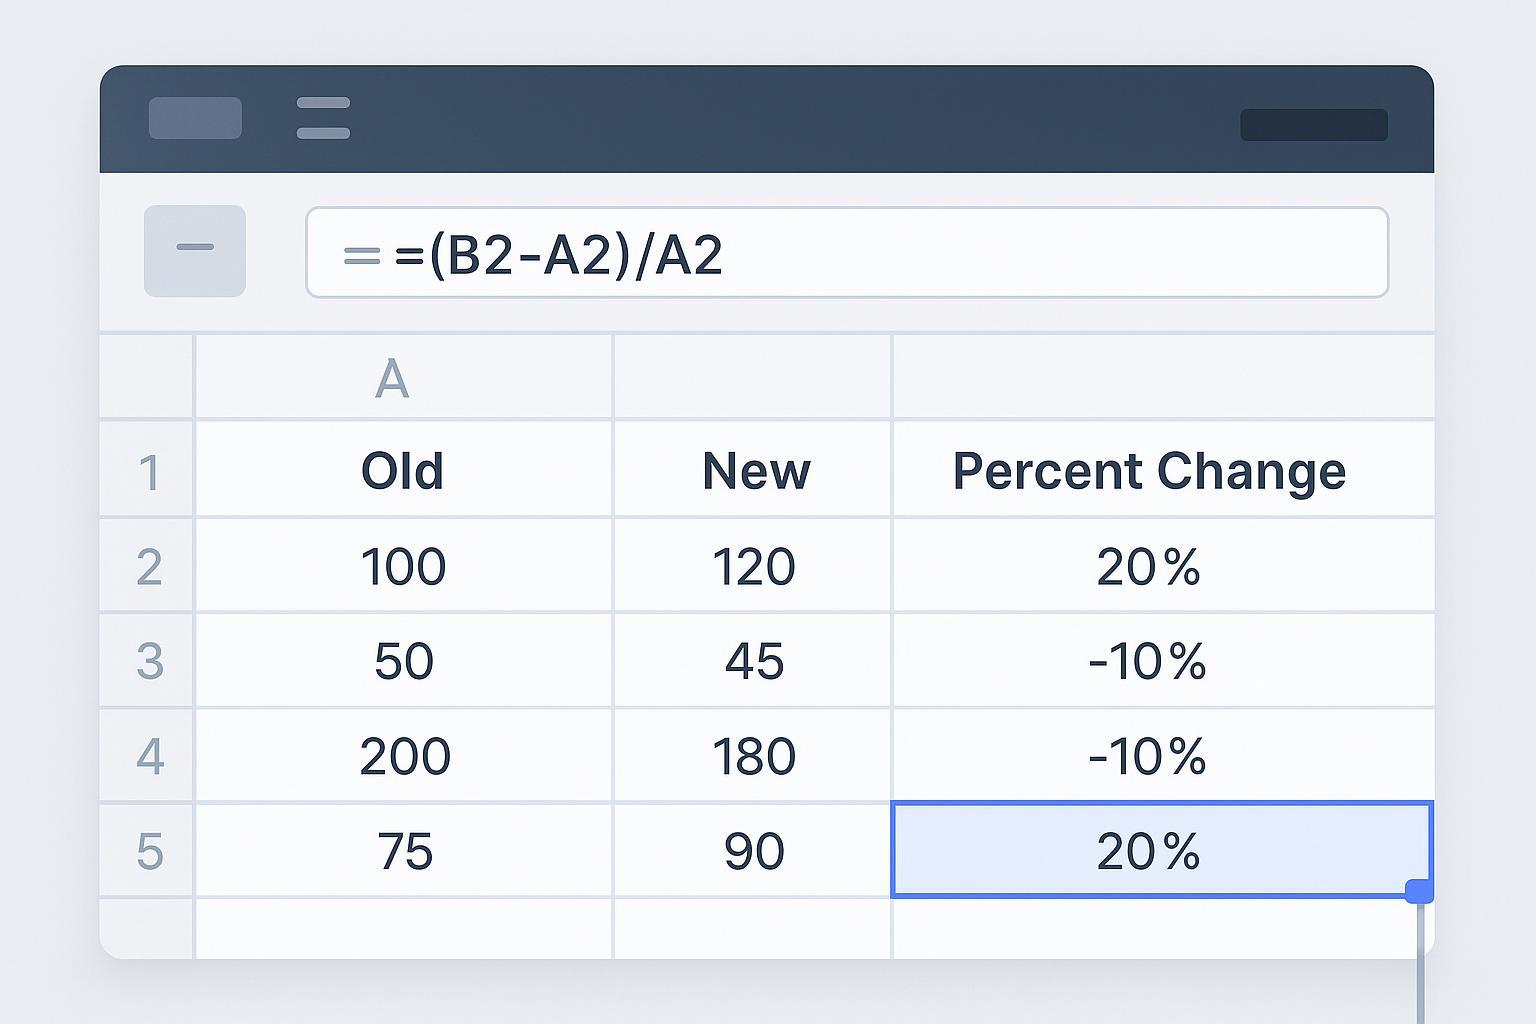
Calculate percentage increases and decreases, copy formulas correctly, and keep zero or negative baselines separate from ordinary growth rates.
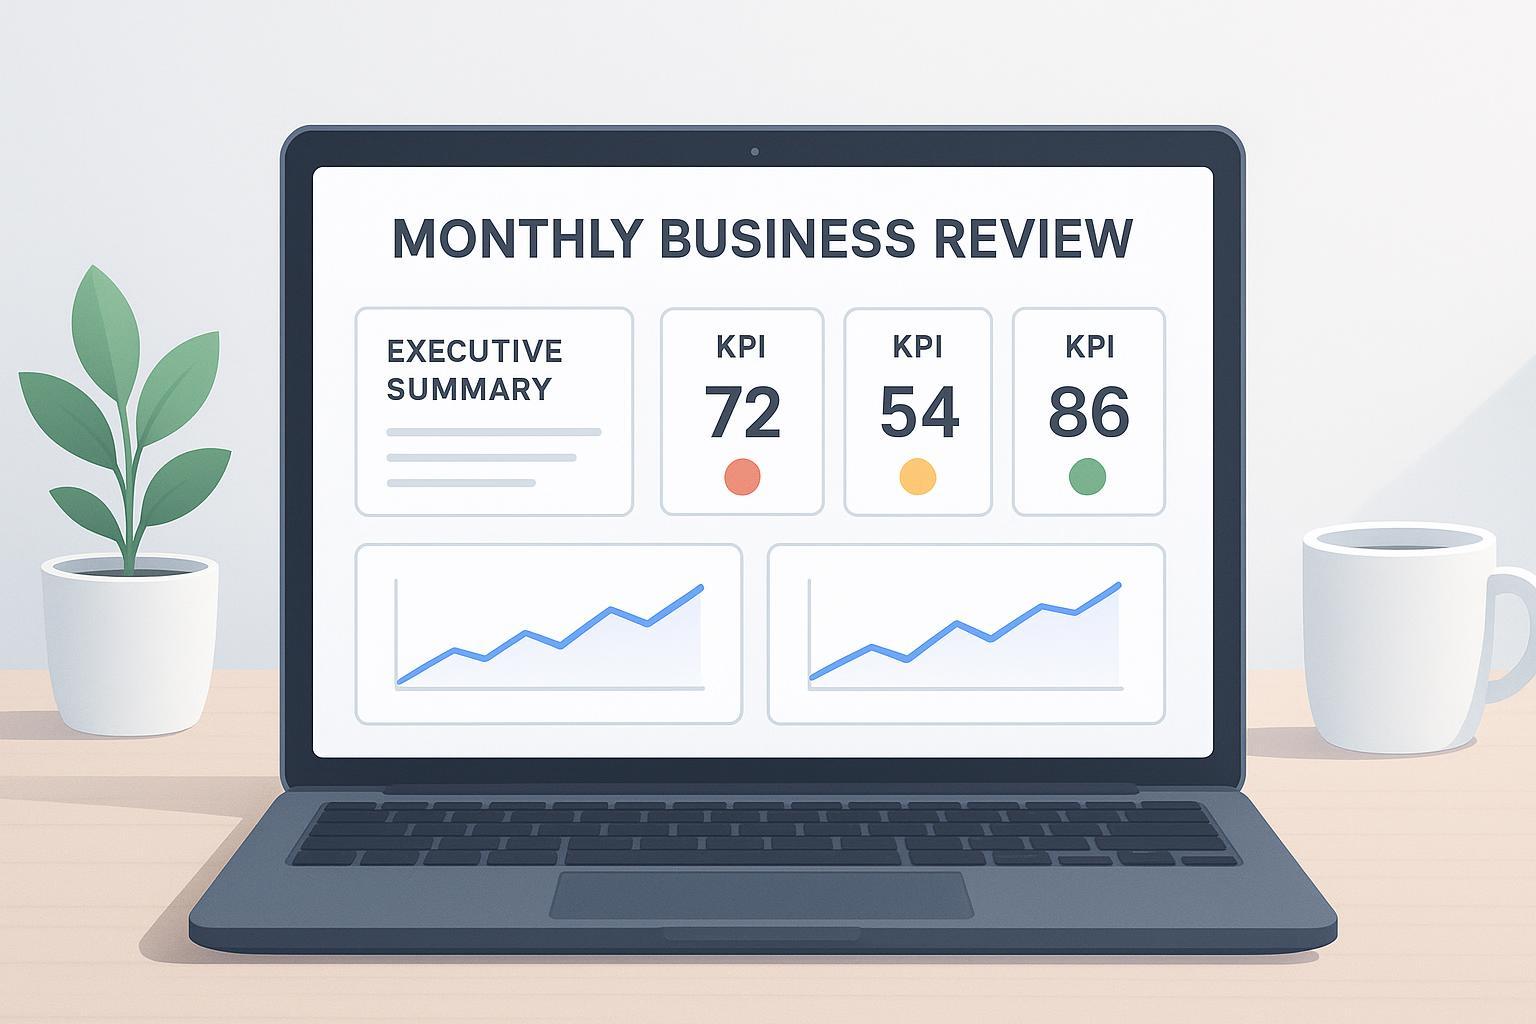
Build an MBR deck from spreadsheet exports with KPI definitions, target comparisons, chart checks, and a practical meeting runbook.
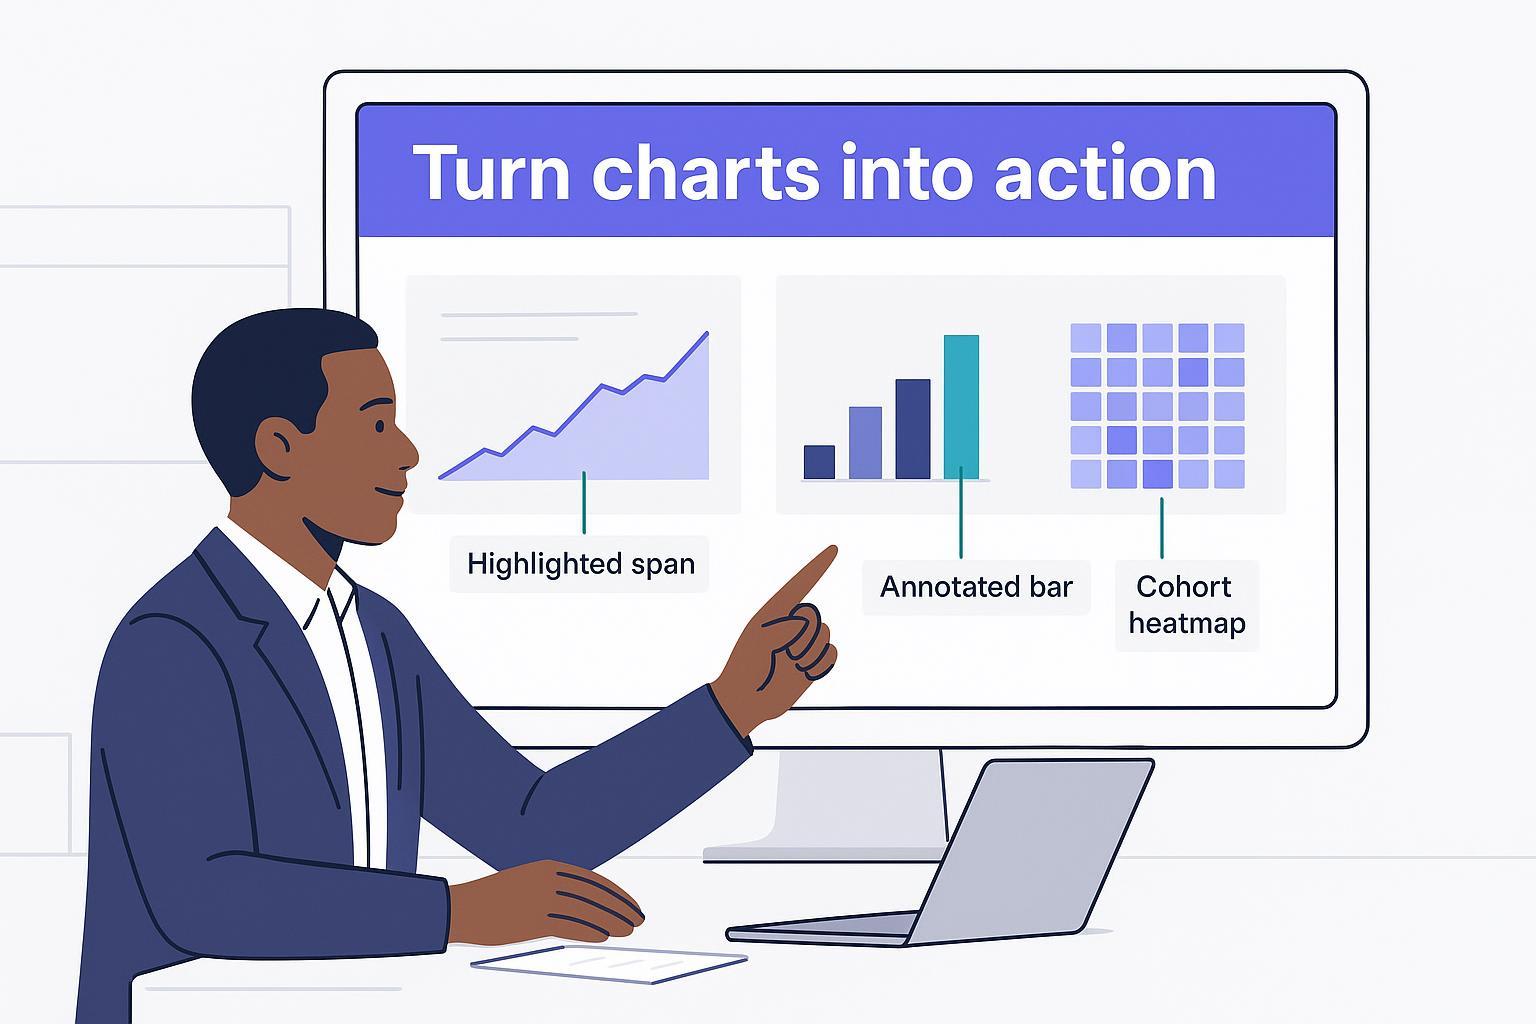
Turn charts into clear takeaway titles, supporting evidence, and reviewable next steps with templates and three worked examples.

Understand local AI, compare deployment options, and evaluate a finance-file workflow that produces traceable exceptions and a review summary.
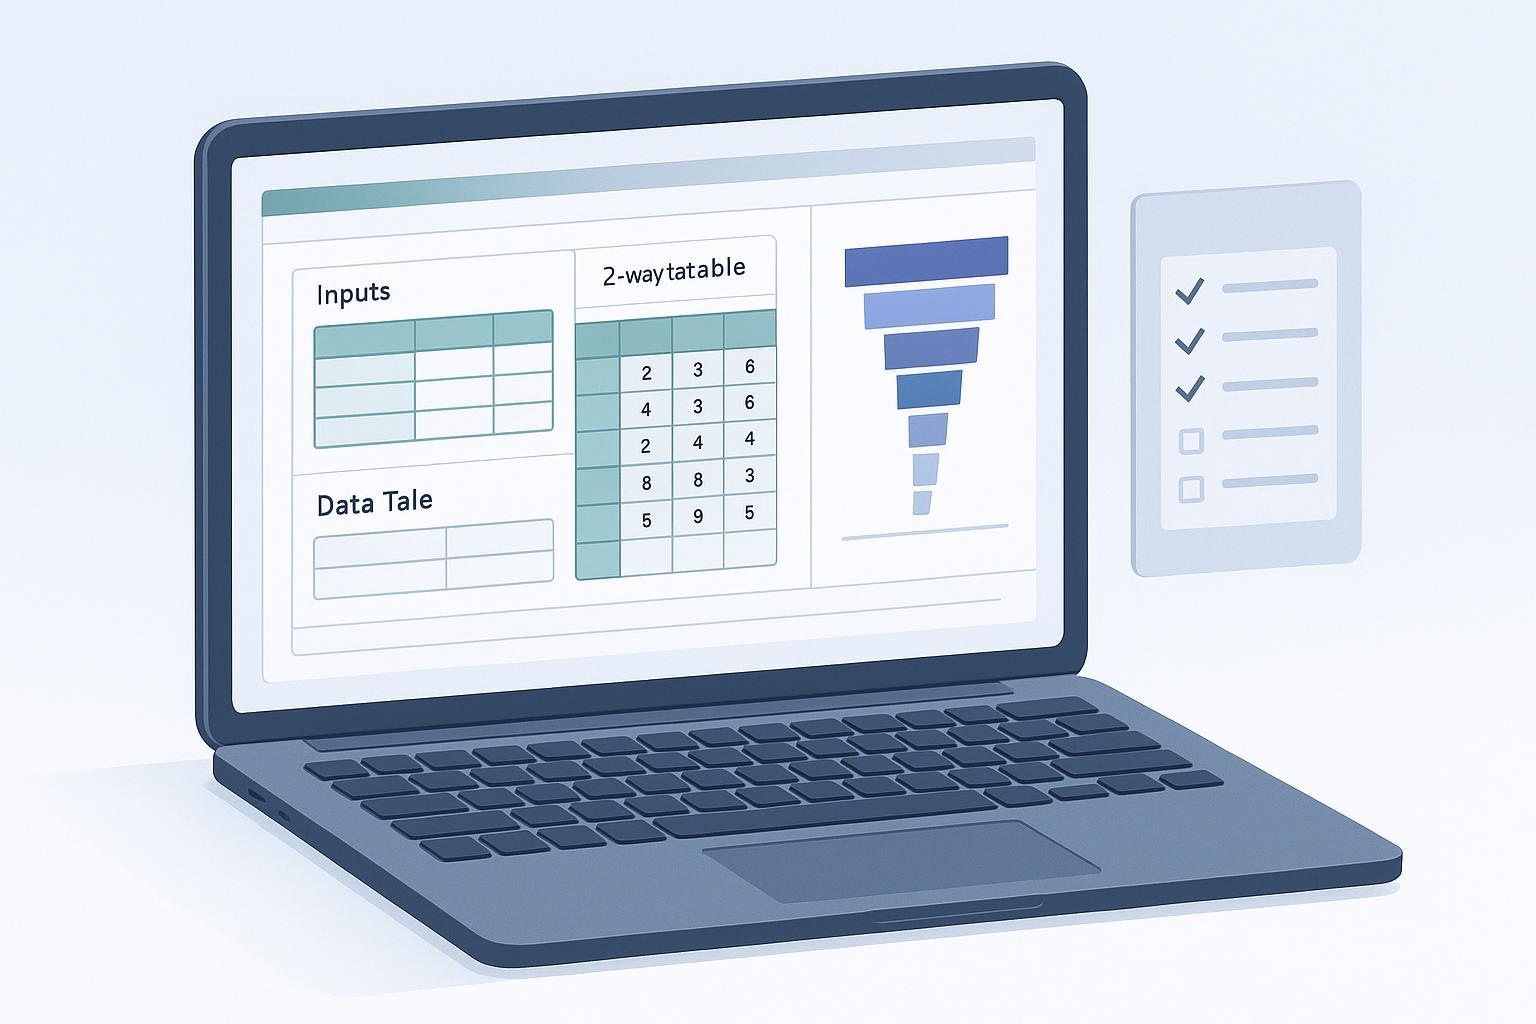
Use Excel formulas, scenario switches, and sensitivity tables with reviewed AI assistance, reproducible examples, and clear audit boundaries.
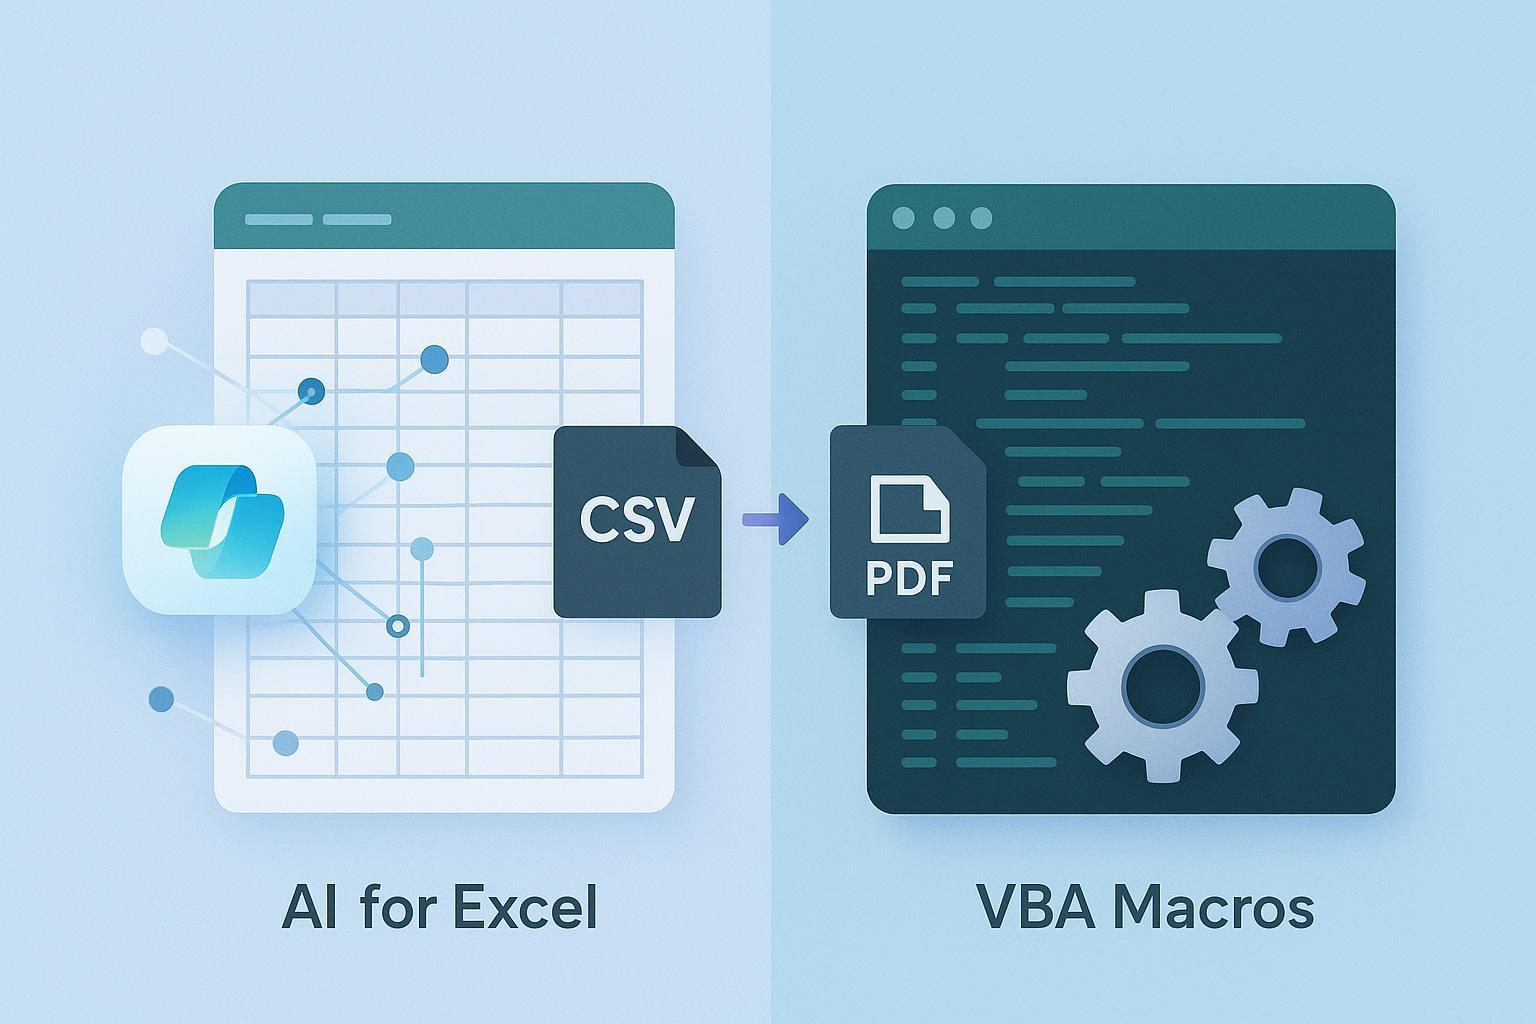
Choose an AI-assisted or coded Excel cleanup workflow by task, repeatability, execution environment, and the effort needed to maintain it.
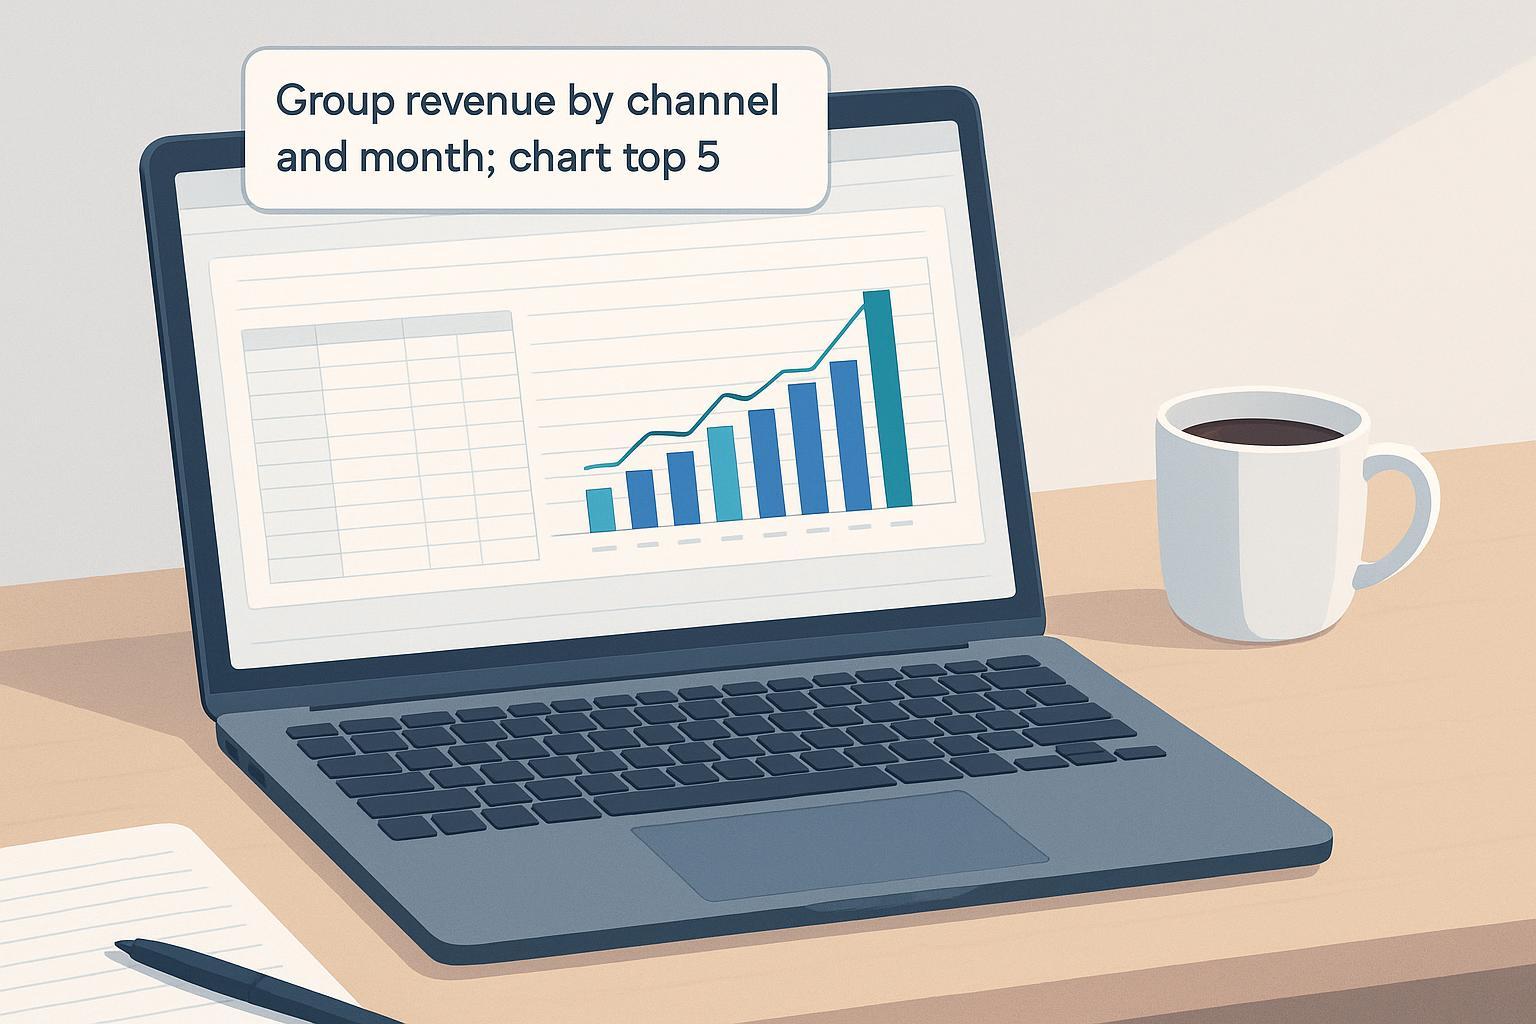
Build a reviewed summary from spreadsheet exports while distinguishing AI-generated tables, native PivotTables, and formula-driven PIVOTBY results.
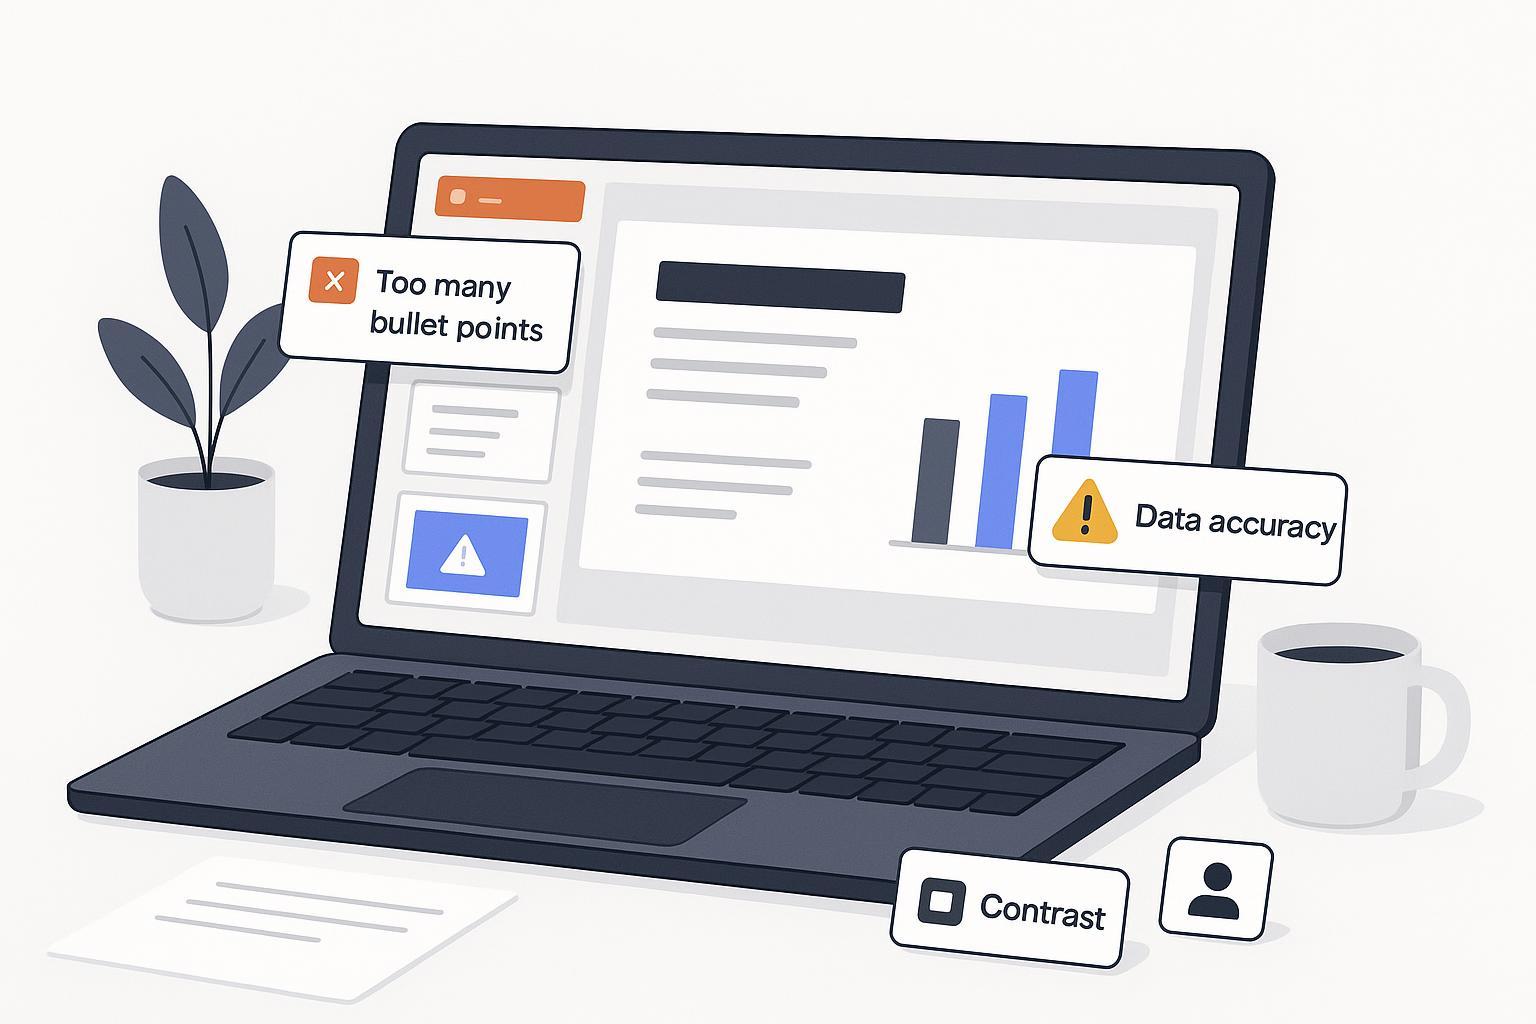
Review AI-generated presentations with source checks, clear narratives, brand guidance, and practical accessibility and sharing checklists.

Apply theme fonts, colors, masters, and reusable slide layouts to an RPA deck, then review branding, accessibility, and supported Copilot options.
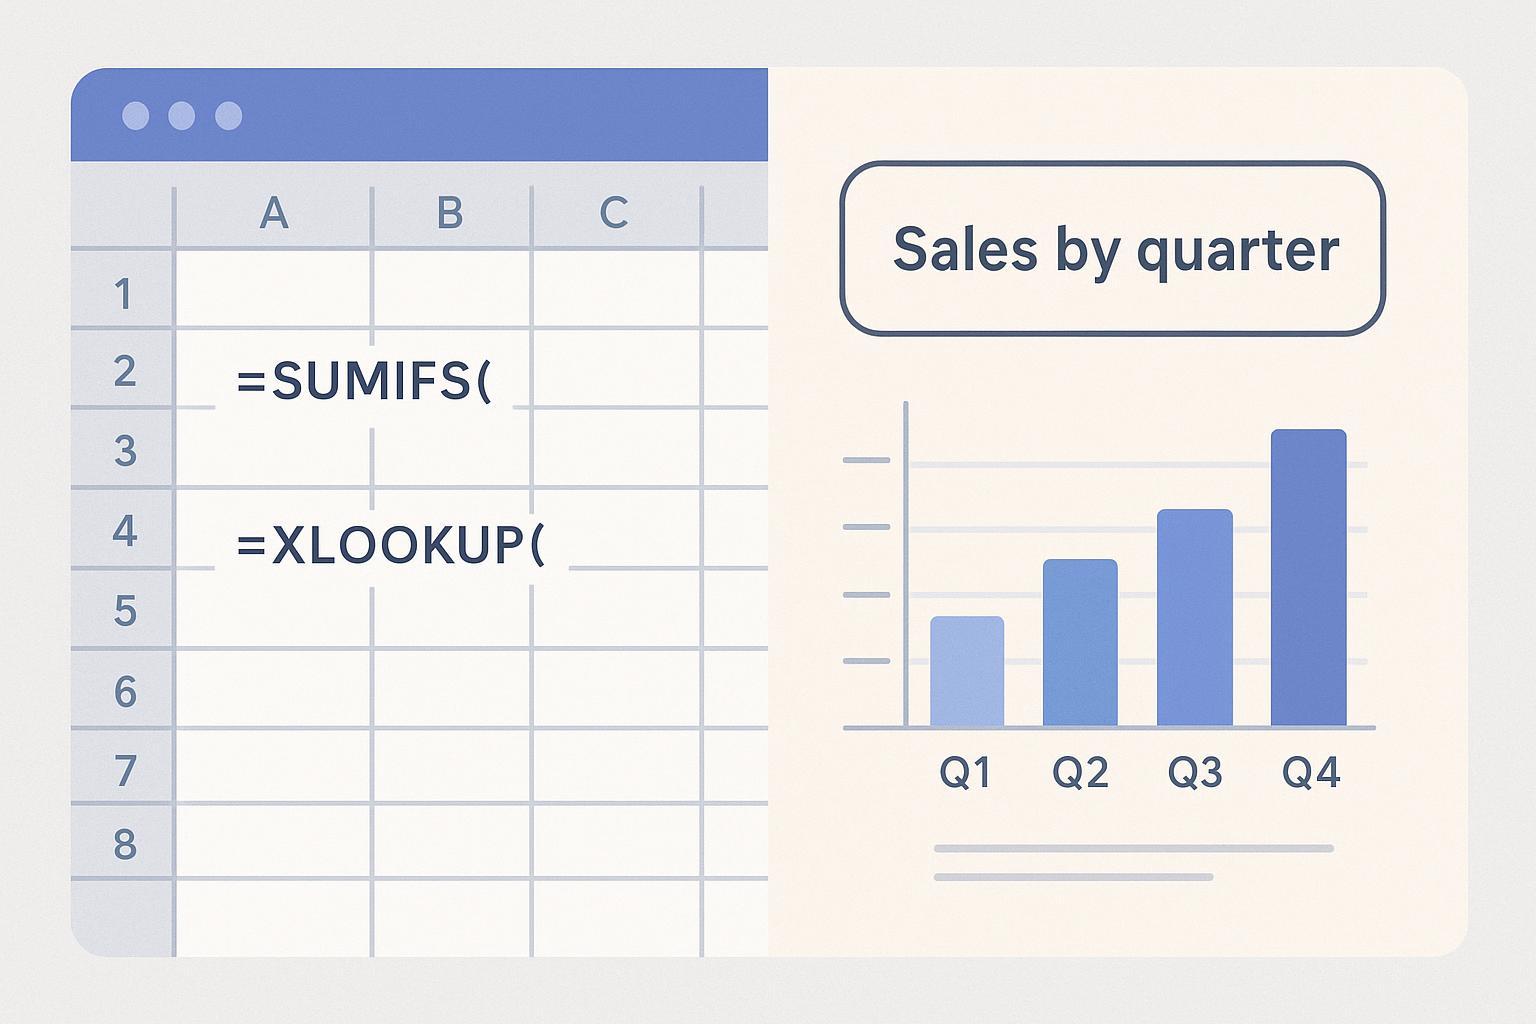
Choose between AI spreadsheet instructions and explicit formulas by task, review needs, repeatability, and the output your team must maintain.
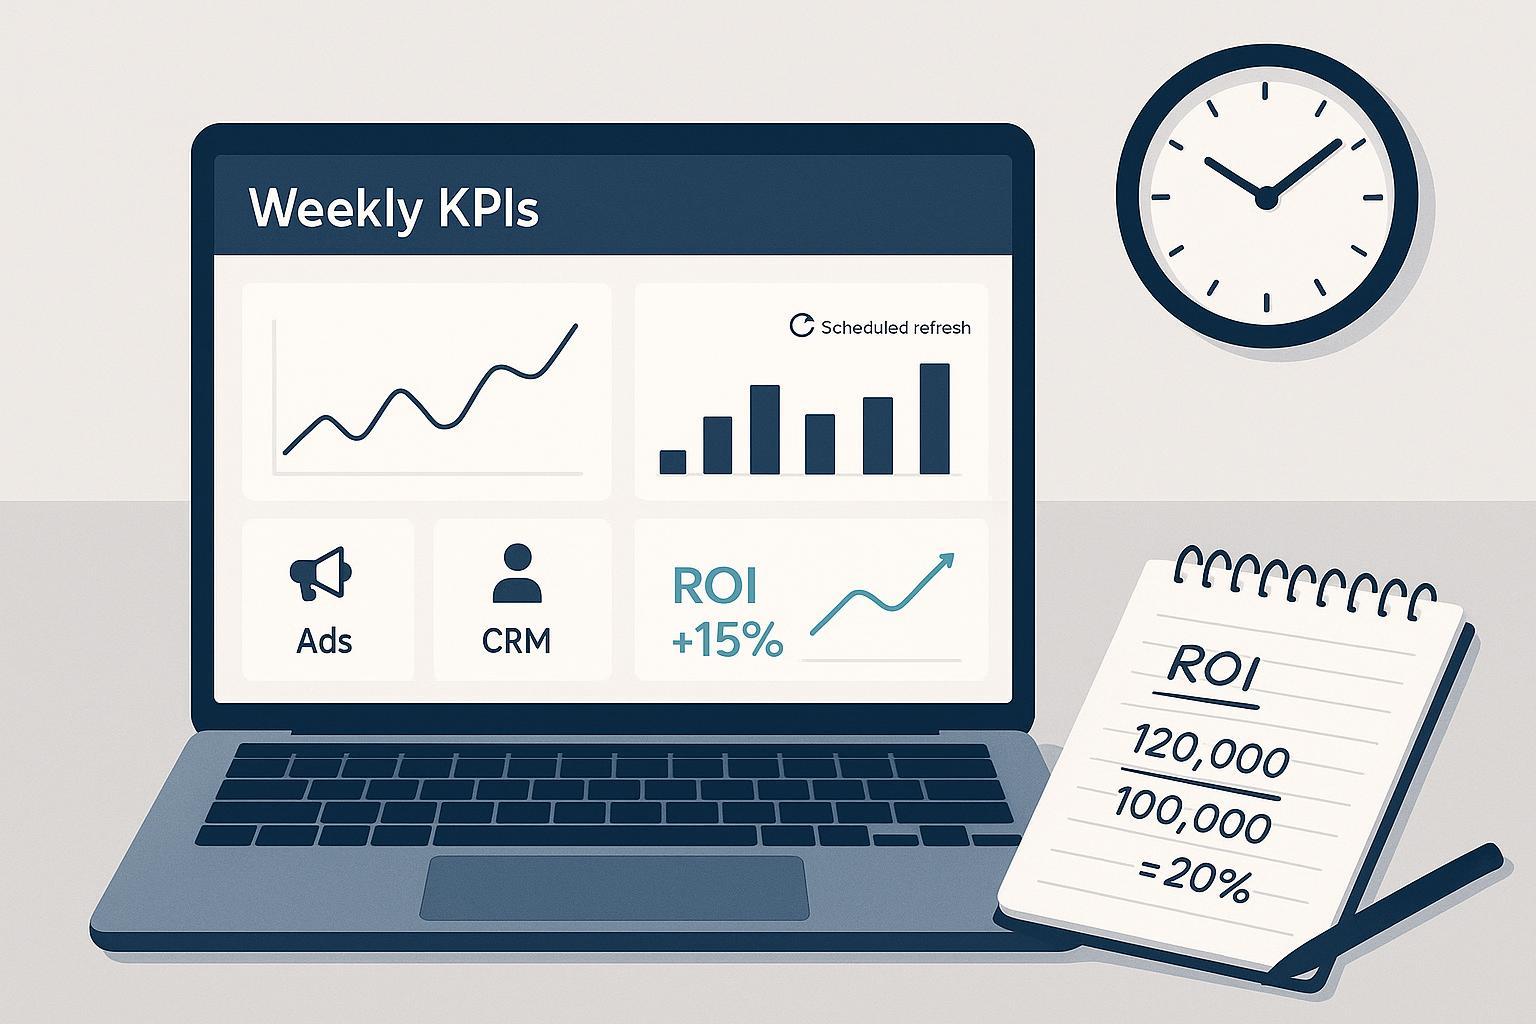
Estimate reporting automation ROI with measured effort, separate setup and recurring costs, and a hypothetical example that distinguishes capacity from cash savings.
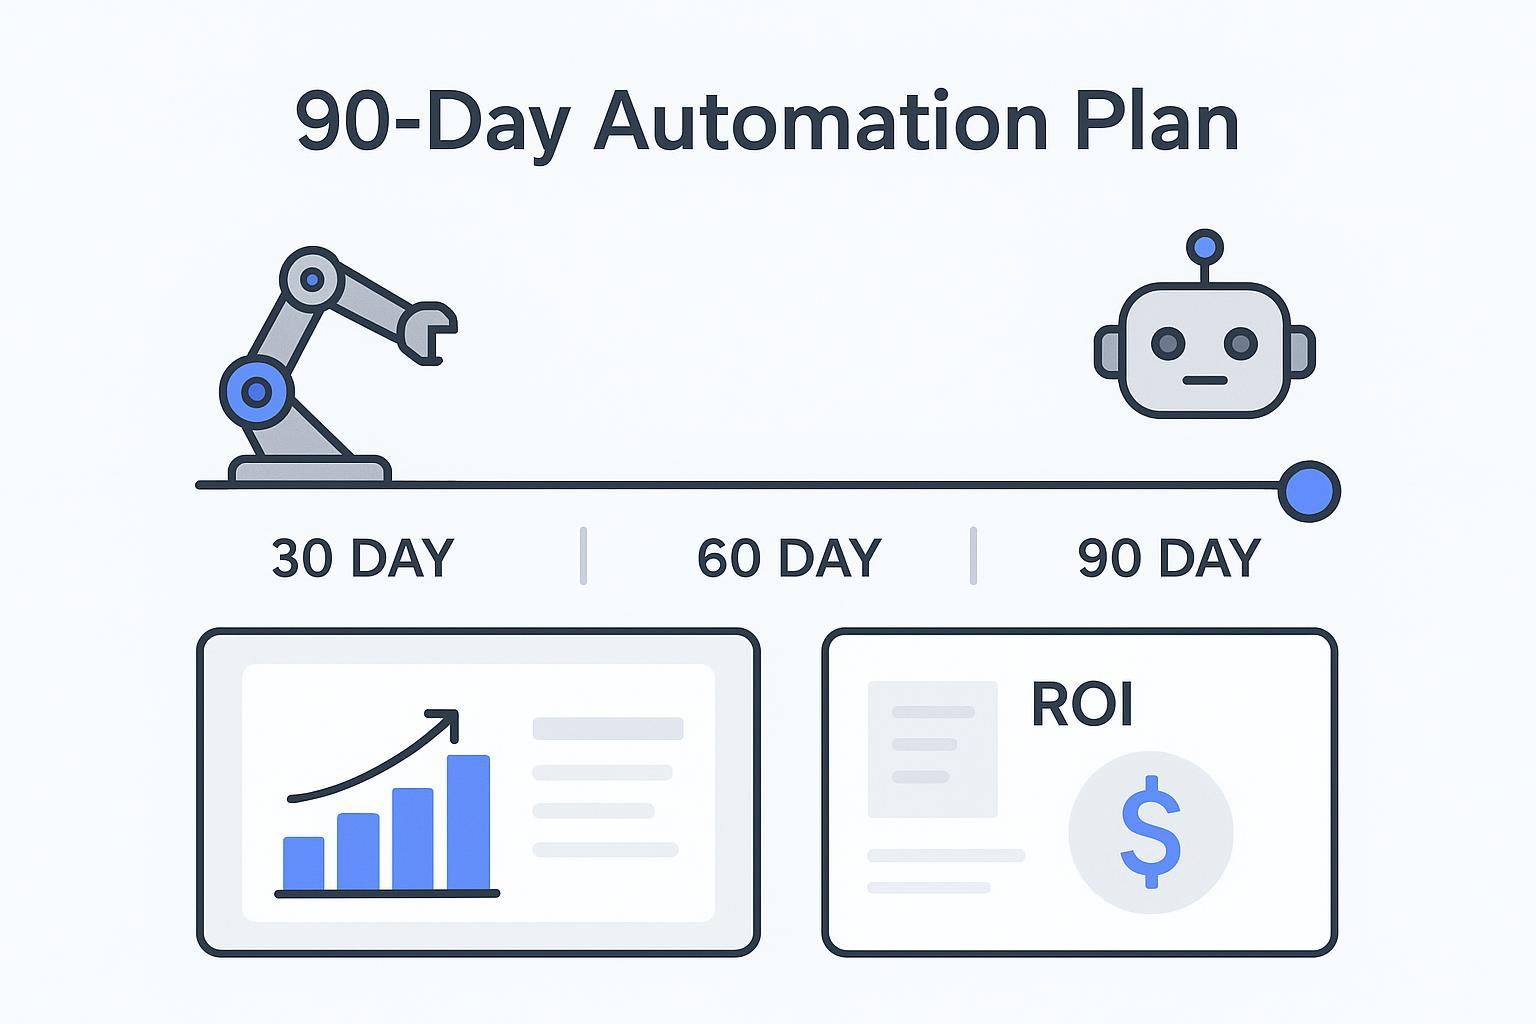
Compare RPA presentation resources and adapt a reusable proposal outline covering roadmaps, ROI assumptions, governance, risks, and decision requests.

Compare twelve process and metric visuals for RPA presentations, with data schemas, PowerPoint build notes, and before-and-after review checks.
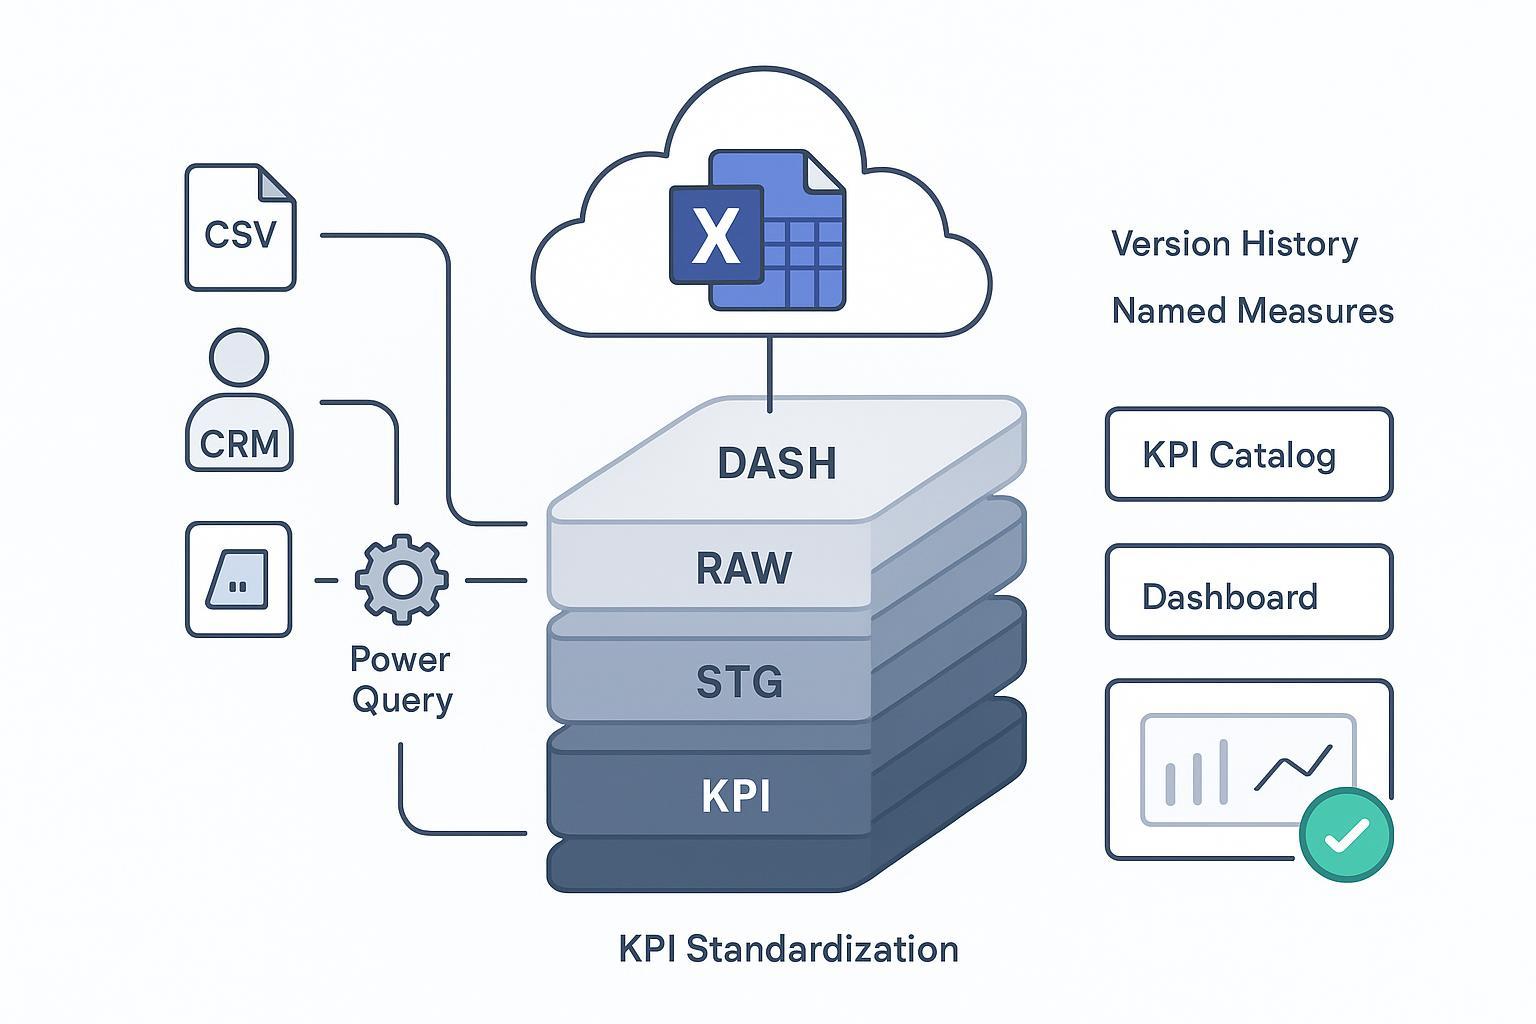
Build a governed KPI workbook with shared definitions, mappings, inspectable calculations, and validation checks that expose missing or inconsistent data.
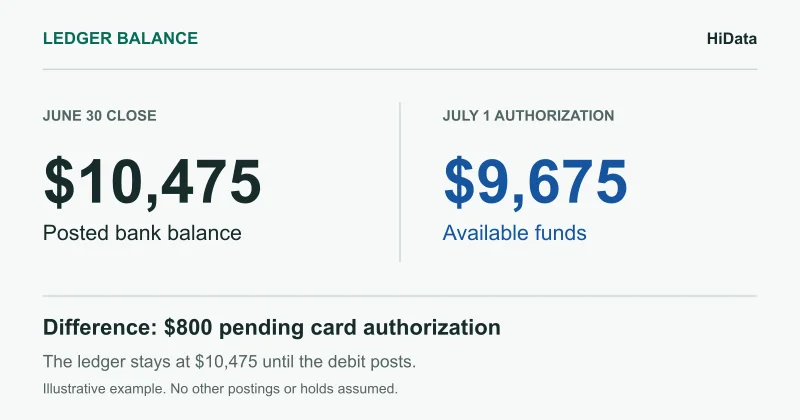
Understand posted bank balances, compare available funds, and work through a ledger balance calculation and reconciliation example in Excel.