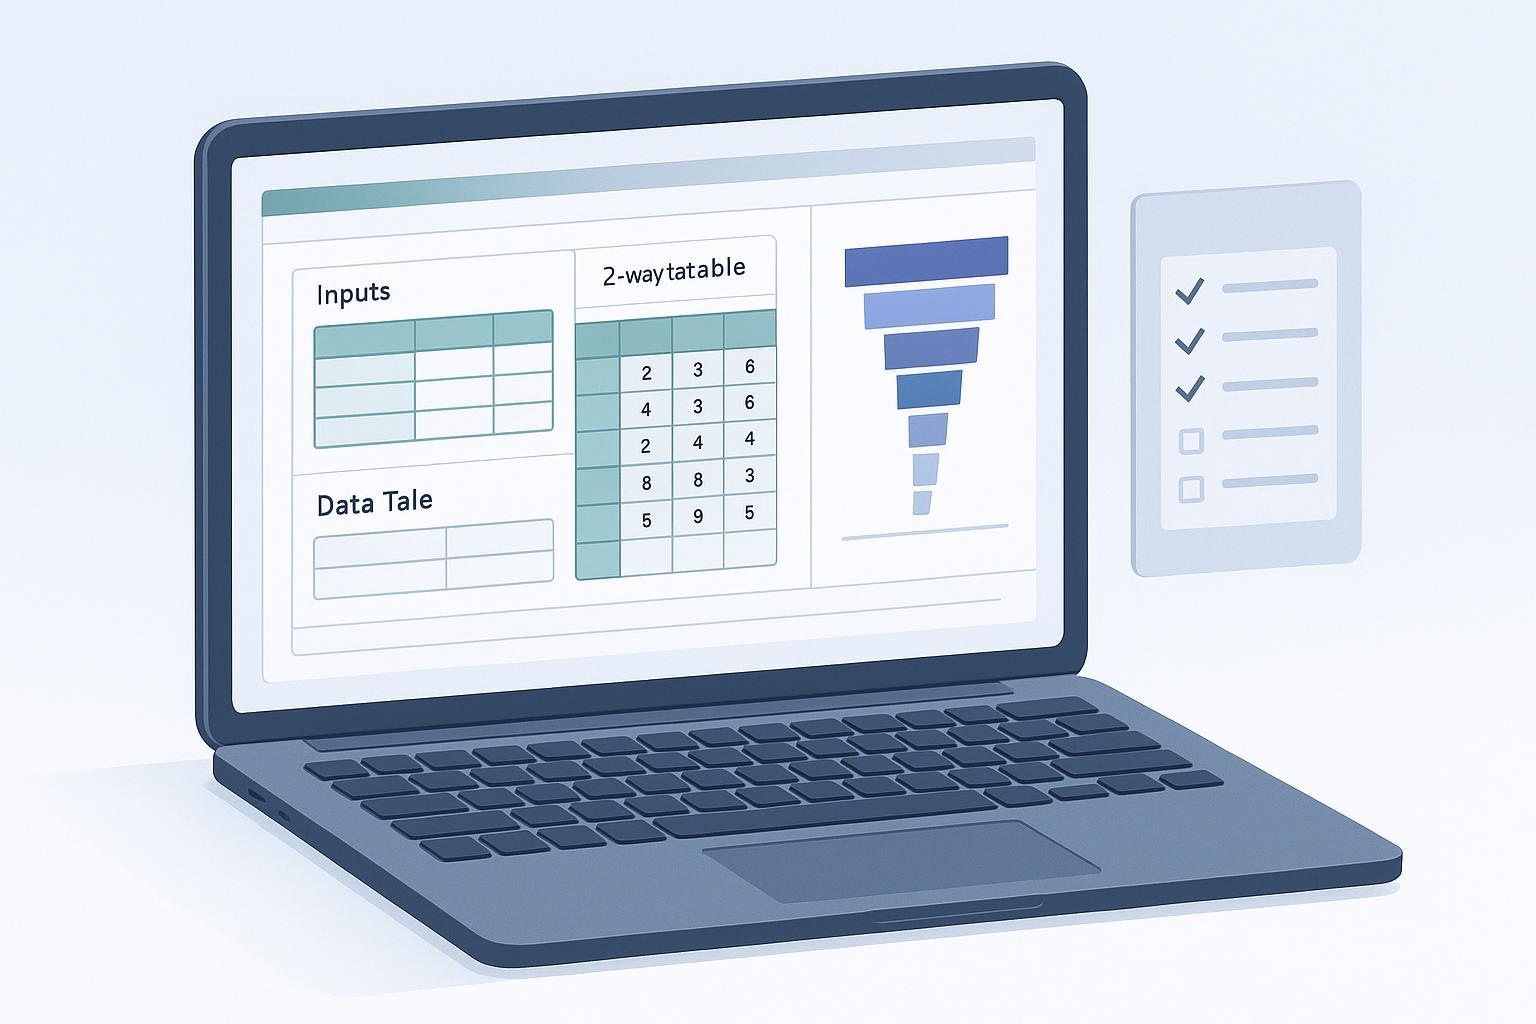
If you build financial models in Excel for planning or board decks, you’re likely juggling two pressures: move faster and stay auditable. The sweet spot is combining Excel-first techniques (named inputs, Data Tables, Power Query) with carefully scoped AI assistance. In this guide, I’ll show practical workflows for scenario analysis, sensitivity testing, and audit trails—plus a compact, worked example you can replicate.
Key takeaways
AI Excel financial modeling works best when core math stays in transparent formulas, while AI speeds cleaning, mapping, and QA.
Treat scenario analysis and sensitivity analysis as separate layers: inputs and switches first, then Data Tables and visuals.
Power Query steps, a maintained change log, and archived workbook versions support review; Microsoft 365 activity logs are an additional control, not a cell-by-cell calculation history.
Use Excel performance settings and nonvolatile functions to keep sensitivity runs snappy at scale.
Where AI fits in AI Excel financial modeling
AI is strongest at tasks around your model: consolidating messy inputs, explaining complex formulas, drafting candidate logic, and surfacing anomalies for review. Keep the governing math in native Excel so every step is traceable. Use AI for documentation and QA, then convert accepted suggestions into explicit formulas and record them in your maintained change log. Preserve the approved budget separately from forecast or scenario versions; an AI-generated scenario is not an approved plan.
Quick-start checklist
Centralize all assumptions on an Inputs sheet with named ranges and clear units; keep calculations and outputs on separate tabs.
Build a simple scenario switch using Data Validation and INDEX or CHOOSE to map “Base,” “Upside,” and “Downside.”
Prepare one-way and two-way What-If Data Tables on the same worksheet as their input cells, then summarize the results on an Analysis tab. If using Automatic except Data Tables while editing, explicitly recalculate and check the tables before review.
Use Power Query to ingest and standardize CSV and system extracts; retain Applied Steps as a record of transformation logic, alongside source files and refresh checks.
Add an Audit Log sheet with timestamp, user, changed range, previous/new value, and reason; archive workbook versions.
Micro-workflow 1: Data ingestion and cleaning with Power Query and AI assist
Illustrative setup allowance, depending on workbook and experience: 10–30 minutes
Power Query turns multi-source inputs into a repeatable pipeline. Create a query for each source (CSV exports from ads, CRM, storefront, or payments). In the Power Query Editor, apply type detection, trim/clean text, split columns, and standardize date and currency formats. Formatting does not convert currencies; retain source currencies and use documented exchange rates if conversion is required. Keep step names descriptive; these “Applied Steps” are a lightweight lineage you can show to stakeholders. Refresh reapplies the query steps to accessible sources; validate source availability, schema changes, join cardinality, and reconciliation totals each time.
Neutral AI assist example (Excel-friendly): If you are consolidating messy campaign exports, an assistant can propose a transformation plan for review. In hiData AI Sheets, upload approved Excel or CSV files and ask to standardize date fields, review campaign labels, and flag unusual values with a stated rule. Check the transformed table against the originals. Implement any required Power Query steps in Excel separately; this does not promise that AI Sheets edits a live workbook or exports a reusable Power Query script. See the data cleaning guide for preparation checks.
Sources: Microsoft’s Power Query best practices emphasize early filtering and proper types to improve performance and refresh reliability. See the official guidance in Power Query best practices (Microsoft).
Micro-workflow 2: Centralize assumptions with named ranges and a clean input sheet
Illustrative setup allowance, depending on workbook and experience: 5–10 minutes
Create an Inputs tab that holds only assumptions with labels and units. Example fields: Price, Units, COGS percent, Fixed costs. Turn each into a named range (Formulas > Define Name). Keep formats consistent and add Data Validation where ranges must be bounded (for example, a nonnegative quantity, or a COGS percentage bounded to 0%–100% if that is an explicit assumption of this simplified model). This improves readability and reduces hard-coded values elsewhere. The separation echoes principles in the FAST Standard and ICAEW guidance on good spreadsheet practice for model transparency and control; see the FAST Standard overview and the ICAEW’s 20 principles for good spreadsheet practice.
Micro-workflow 3: Build a scenario switch with Data Validation and INDEX or CHOOSE
Illustrative setup allowance, depending on workbook and experience: 10–20 minutes
Add a drop-down in Inputs!A2 with the options Base, Upside, and Downside. Put those same labels in Inputs!N5:N7; put corresponding price multipliers in O5:O7 and unit multipliers in P5:P7. Define workbook-scoped names ScenarioList = Inputs!$N$5:$N$7, PriceMultiplier = Inputs!$O$5:$O$7, and UnitsMultiplier = Inputs!$P$5:$P$7. Define Price_base and Units_base as separate numeric assumption cells. Then calculate scenario driver cells with:
Price_effective: =Price_base*INDEX(PriceMultiplier, MATCH(Inputs!$A$2, ScenarioList, 0))
Units_effective: =Units_base*INDEX(UnitsMultiplier, MATCH(Inputs!$A$2, ScenarioList, 0))
Reviewers can inspect the scenario labels, multipliers, and effective inputs on the sheet. All three named lists must have the same order and length. Avoid circular references: the effective driver must depend on a separate base assumption. This is a separate scenario-switch pattern; the worked sensitivity example below uses direct Price and Units inputs.
Micro-workflow 4: Sensitivity analysis with Data Tables and a simple tornado visual
Illustrative setup allowance, depending on workbook and experience: 10–30 minutes
One-way Data Table steps
List test values for a single input down a column. Put the output formula one row above and one column to the right of the first test value. Select the rectangle containing the values, output formula, and empty result cells; choose Data > What-If Analysis > Data Table and set Column input cell to the model input being varied on that worksheet. See Microsoft’s Data Table instructions for the layout and row/column mapping.
Two-way Data Table steps
Put one input’s values across a header row (e.g., Units from 800 to 1,200) and the other input’s values down a column (e.g., Price from 18 to 30). Place the output formula in the top-left corner of the grid (intersection of the headers). Select the full grid, then set Row input cell to the driver represented by the top-row values and Column input cell to the driver represented by the first-column values. Keep these input cells on the table’s worksheet and outside the result grid.
Performance tips
Data Tables trigger repeated recalculation. A suitable calculation mode and fewer volatile formulas can reduce repeated work. If using Manual or Automatic except Data Tables while editing, explicitly recalculate the complete model and sensitivity tables before reading or sharing the results. INDEX can replace volatile OFFSET in appropriate reference patterns. See Microsoft’s guidance in Improving calculation performance in Excel and related performance tips.
Tornado chart workaround
A tornado-style sensitivity chart can be built from horizontal bars showing low and high deviations from a base result. Sort drivers by the size of their tested effect, label the low/high assumptions, and use zero as the delta baseline. Python in Excel can also plot the results with Matplotlib when that feature is available; see Microsoft’s supported Python libraries. That is an Excel feature, not a hiData capability claim.
Micro-workflow 5: Monte Carlo in Excel with established add-ins
Illustrative setup allowance, depending on workbook and experience: 15–60 minutes
For uncertainty beyond discrete scenarios, Monte Carlo simulation propagates distributions through your model to output ranges and percentiles. Well-known Excel add-ins integrate via custom functions and ribbons, such as ModelRisk (Vose Software) and @RISK (Lumivero, formerly Palisade). Use them where you need probability distributions on key drivers (e.g., churn, price, lead volume). Keep the simulation layer modular: inputs and core formulas should remain readable and auditable, with the simulation calls clearly tagged. For an orientation to capabilities, see vendor pages like Vose’s overview of ModelRisk for Excel and Lumivero’s @RISK. Treat vendor claims cautiously and validate outputs against small hand checks.
Worked numeric example you can reproduce in one sitting
We will build a hypothetical three-tab workbook: Inputs, Model, and Analysis. All monetary inputs use USD for the same illustrative period. Profit here means simplified operating profit before interest, tax, and any costs not listed; this is not a complete valuation or approved forecast.
Inputs
On Inputs, define workbook-scoped names Price = Inputs!$B$2, Units = Inputs!$B$3, COGS_pct = Inputs!$B$4, and Fixed_cost = Inputs!$B$5. Use Price = $24 per unit, Units = 1,000 units, COGS_pct = 40% of revenue, and Fixed_cost = $8,000 for the same period.
Model
On Model, define workbook-scoped names Revenue = Model!$B$2, COGS = Model!$B$3, Gross_Profit = Model!$B$4, and Profit = Model!$B$5, then enter:
Revenue (B2): =Price*Units
COGS (B3): =Revenue*COGS_pct
Gross_Profit (B4): =Revenue-COGS
Profit (B5): =Gross_Profit-Fixed_cost
With the example inputs, you should see: Revenue 24,000; COGS 9,600; Gross Profit 14,400; Profit 6,400.
Analysis
One-way sensitivity on Price: keep the What-If Data Table on Inputs so it shares a worksheet with its driver. Enter prices 18 through 28 in Inputs!D2:D12 and =Profit in Inputs!E1. Select Inputs!D1:E12, then Data > What-If Analysis > Data Table; leave Row input cell blank and set Column input cell to Inputs!$B$2. Results fill E2:E12. Profit is $2,800 at price $18, $6,400 at $24, and $8,800 at $28. Each $1 price increase adds Units × (1 − COGS_pct) = $600 to profit under these assumptions. Analysis can reference this completed result range for charts.
Two-way sensitivity on Price and Units: on Inputs, enter =Profit in G1, units 800, 900, 1,000, 1,100, 1,200 in H1:L1, and prices 18 through 28 in G2:G12. Select G1:L12 and create a Data Table with Row input cell = Inputs!$B$3 (Units) and Column input cell = Inputs!$B$2 (Price). Keep the inputs outside the table. Check that 1,000 units at $24 returns $6,400; 800 at $18 returns $640; and 1,200 at $28 returns $12,160. Summarize or visualize the results on Analysis after recalculation.
Tornado setup: change one driver at a time from the base, record low and high profit, then restore the base before testing the next driver. Price ±10% gives profit $4,960/$7,840; Units ±10% gives $4,960/$7,840; COGS_pct 35%/45% gives $7,600/$5,200; Fixed_cost ±10% gives $7,200/$5,600. Thus the profit deltas are ±$1,440, ±$1,440, ∓$1,200, and ∓$800 respectively. COGS changes by 5 percentage points, not 5% of its base rate. Plot low/high deltas from zero and sort by their tested span. The ranking depends on the ranges chosen, so it is not a universal ranking of business importance.
Validation checks and safeguards
Add a check cell such as =IF(ABS(Revenue-(COGS+Gross_Profit))<0.01,"OK","Check math") for the USD example. This only checks one arithmetic identity; if Gross_Profit is defined as Revenue minus COGS, it cannot independently validate inputs, mappings, or the business model. Also compare source totals and manually recompute the base and selected sensitivity cases. For this illustrative model, validate numeric inputs with 0% ≤ COGS_pct ≤ 100%, Units ≥ 0, Price ≥ 0, and Fixed_cost ≥ 0; use different bounds where the business permits them.
Why this matters
Spreadsheet review should cover inputs, logic, assumptions, and outputs rather than rely on a generic error-rate percentage. ICAEW’s good spreadsheet practice provides a relevant control framework. A sensitivity result is conditional on assumptions; a polished chart does not validate those assumptions.
Audit trails finance leaders can defend
Workbook-internal logging
Add an Audit Log sheet with fields: Timestamp, User, Worksheet, Cell/Range, Previous Value, New Value, Change Type, Reason, Source/Query, Related Prompt, Version ID, Reviewer. Populate it manually or through a separately implemented, tested logging process when assumptions or formulas change. An empty Audit Log sheet does not automatically capture edits. Worksheet protection can reduce accidental changes but is not a substitute for access control or an immutable audit trail; archive reviewed milestone versions.
Power Query lineage
Treat the Applied Steps pane as a record of the query’s current transformation logic, not a complete historical log of every prior edit or every source row. Preserve source exports, query versions, refresh results, and reconciliation checks if the review needs to be reproduced. Available diagnostic tools vary by Power Query host and version.
Microsoft 365 file activity logs
For SharePoint/OneDrive-hosted workbooks, Microsoft Purview Audit captures create, edit, share, and access events. Finance and IT can search, filter, and export CSV logs to review recorded file activity. Available events, search permissions, retention, and licensing vary; file events do not establish the old/new value of every workbook cell. See Microsoft’s Purview audit solutions overview and the activity catalog and detailed properties to understand what’s recorded and for how long.
Governance guardrails you can adopt now
Separate Inputs, Calculations, and Outputs; embed checks; document assumptions; and schedule periodic peer reviews for high-risk models. These practices align with the FAST standard and ICAEW’s code of good modeling practice referenced earlier. Keep critical calculations in plain formulas; use AI primarily for documentation, reconciliation, and QA prompts.
Tool integrations at a glance
Tool | Best use | Setup notes | Common pitfalls |
|---|---|---|---|
Microsoft Copilot for Excel | Explaining formulas, drafting candidate formulas, quick charts/Pivots, QA prompts | Requires an eligible account, license, and supported Excel version; check the current workflow and file requirements | Don’t rely on AI for final numerics; keep core math in native formulas; verify data context and feature availability; supported workflows change |
Power Query | Repeatable data cleaning and consolidation with step lineage | Use separate queries per source; set correct data types early; document steps | Unnecessary columns, late filtering, wrong types, and ambiguous joins can affect performance or duplicate rows |
Data Tables | Fast one- and two-way sensitivity sweeps | Use the correct corner/top-right formula layout and same-sheet inputs; recalculate before review | Volatile functions slow recalcs; avoid entire-column references; very large grids can lag |
Monte Carlo add-ins | Probabilistic modeling for key uncertainties | Install vendor add-in; model distributions for uncertain drivers; run trials | Hidden cross-sheet dependencies and circular refs can break simulations; validate with hand checks |
Privacy, accuracy, and performance notes
Keep sensitive models local or within your organization’s governed cloud. Use only tools approved for those files; a data-processing agreement alone does not settle access, retention, residency, or permission requirements.
Use AI to draft or explain formulas, then convert accepted logic into transparent Excel functions. Keep prompts and rationale in your Audit Log.
Manage performance: prefer INDEX/XLOOKUP over OFFSET/INDIRECT; confine ranges; avoid volatile functions; and use Excel’s “Automatic except Data Tables” mode when building sensitivity models. Microsoft’s calculation guidance linked earlier provides additional tips.
What a neutral AI helper can do next
If you have standardized inputs and calculated the sensitivity layers in Excel, upload approved exports of the reviewed results to AI Sheets to analyze tables and draft charts or summaries. Ask it to identify the tested driver ranges and supporting result rows rather than invent reasons for a change. Use AI Slides to draft presentation content from those reviewed findings. Excel remains responsible for native workbook recalculation and What-If Data Tables; this workflow does not claim hiData runs them or maintains an audit log.
Next steps
Want to try a natural-language assistant that works alongside Excel for data prep and reporting? Explore hiData AI Sheets to see how it ties into a spreadsheet-first workflow.
References and further reading
Microsoft Learn. Improving calculation performance in Excel; performance obstructions tips; Power Query best practices; Purview audit solutions and activity catalogs.
ICAEW. 20 principles for good spreadsheet practice; Financial Modelling Code.
FAST Standard. Spreadsheet modeling structure and discipline.
Microsoft Support. What-If Data Tables, Python libraries, and current Copilot in Excel requirements.
Keep the base workbook, scenario assumptions, sensitivity results, and reviewer notes together so the next analyst can reproduce the conclusions.
