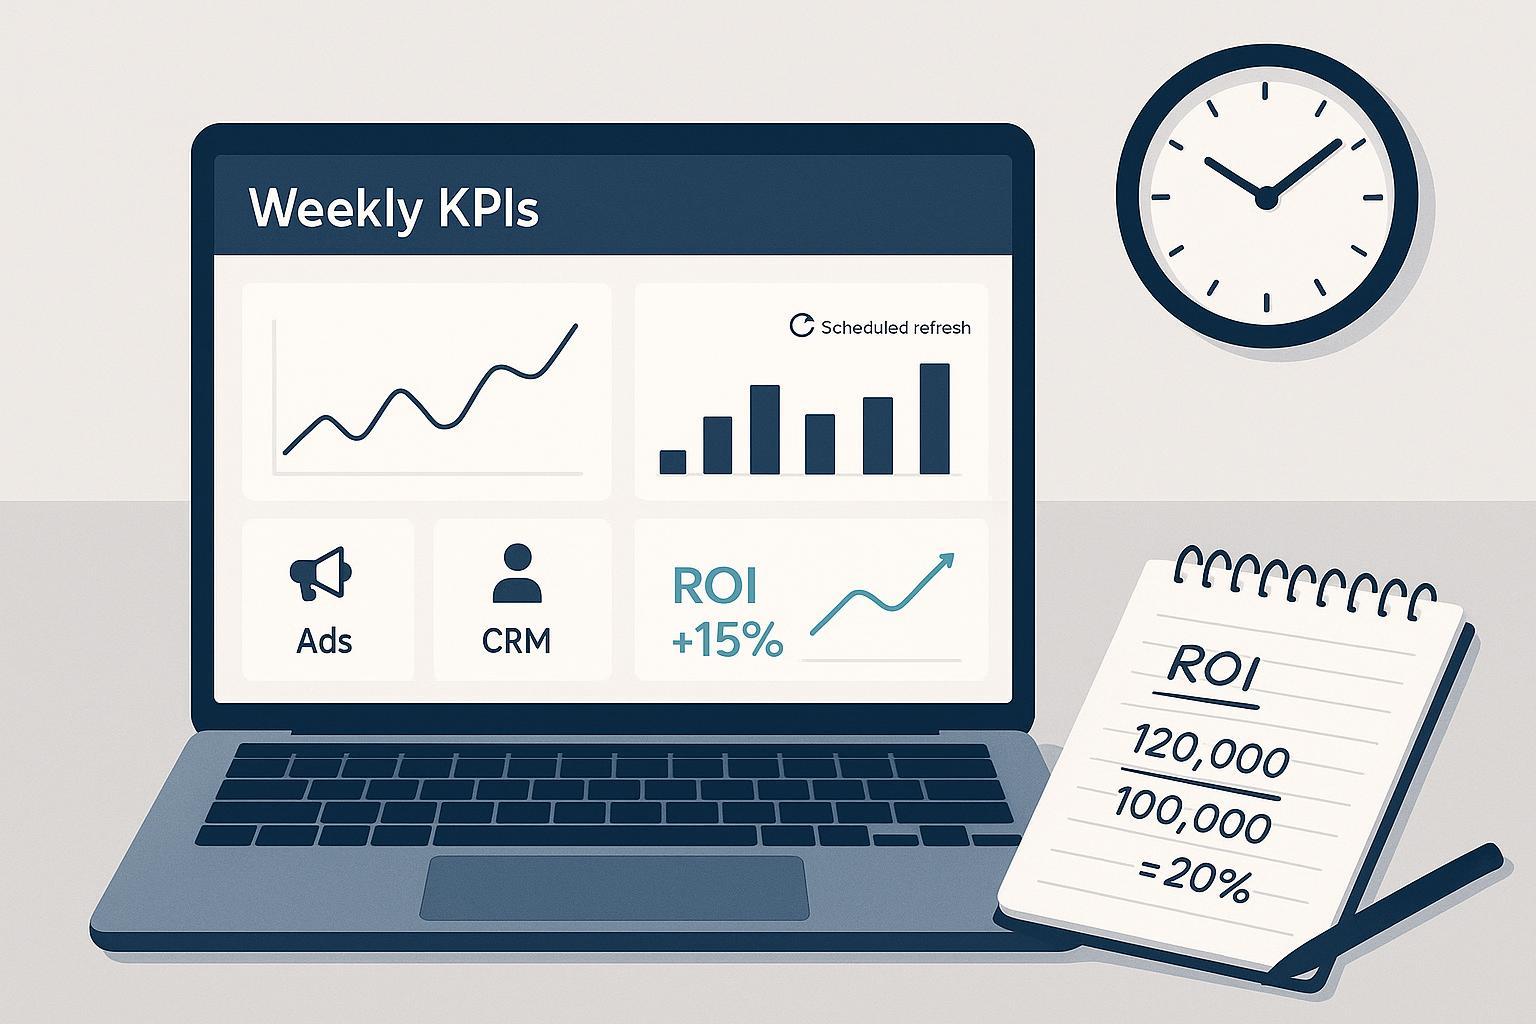
If your Mondays start with copy-pasting exports, reconciling mismatched columns, and rebuilding the same charts, those activities have a measurable labor cost. Automating parts of weekly KPI reporting can reduce preparation work, but review, maintenance, and exception handling still take time. This guide shows how to estimate the return with explicit assumptions, inspectable formulas, and a worked example instead of assuming a standard savings rate.
Key takeaways
Calculate return from your own baseline and measured residual work. Include review, maintenance, and setup costs.
Record hours, contributors, labor rate, reporting frequency, and separate rework. Then estimate the savings fraction, recurring operating costs, and one-time setup investment.
Treat time savings as a pilot result, not a benchmark. Include the time still spent checking outputs, correcting failures, and maintaining the workflow.
A spreadsheet calculator can distinguish net ROI, benefit-cost ratio, and payback. Valued staff capacity is not automatically a cash saving.
What drives the ROI of automating weekly KPI reports
Three levers drive most of the return.
First, reduced reporting effort can free staff capacity. Record the work that actually disappears and value it at an appropriate rate. Wider analytics studies are useful context, but not weekly-report benchmarks: Microsoft’s summary of its commissioned 2024 Forrester Fabric study reports a modeled three-year ROI of 379% for a composite enterprise. Its scale, assumptions, and benefit categories differ from an SMB reporting pilot; do not import that return into your forecast.
Second, error reduction may avoid rework, but it must be measured. Track corrections and reconciliation time before and after the change. If those hours are already part of your baseline preparation time, do not add them again. Spreadsheet controls and documented definitions matter whether the report is manual or automated; see ICAEW’s spreadsheet practice guidance.
Third, an earlier, reliable report may help decisions. Keep that possible opportunity value separate from valued time savings unless you can substantiate an incremental outcome and avoid double counting. Reallocating a saved hour to analysis does not create a second hour of labor saving, and a faster report alone does not establish additional revenue.
How to measure your baseline reporting cost
Collect a representative baseline before estimating savings. Use your team’s fully burdened rates and currency where possible. As a historical U.S. reference, BLS reported average private-industry compensation of $45.65 per hour worked in June 2025, including wages and benefits. It is not a role-specific or globally conservative rate. The fixed BLS June 2025 ECEC release preserves that period instead of linking to a PDF that changes with each release.
Inputs to collect (weekly unless noted):
H: Average hours per contributor per reporting cycle, excluding the separately counted rework E
N: Number of contributors; use total person-hours directly instead if individual hours differ substantially
R: Fully burdened hourly rate ($/hour)
F: Reporting cycles per year; use 52 for this weekly example, not four cycles per month
E: Additional rework person-hours per month across the whole team, excluding hours already in H
C: Annual recurring software, hosting, and support costs, excluding one-time setup and labor already reflected in the residual reporting hours
S: Fraction of baseline preparation plus rework hours eliminated after allowing for residual review and correction work (0 to 1)
I: One-time setup, migration, and training investment, kept separate from C
Outputs you’ll compute:
Annual manual cost
Annual valued capacity released, annual net economic benefit, and first-year net benefit
First-year net ROI percentage and benefit-cost ratio
Illustrative economic payback months under a stated benefit ramp
Item | Symbol | Example |
|---|---|---|
Weekly hours per contributor | H | 8 |
Contributors | N | 1 |
Hourly rate (fully burdened) | R | $60 |
Frequency per year | – | 52 |
Additional team rework hours per month | E | 4 |
Annual recurring operating cost | C | $3,600 |
Fraction of baseline hours eliminated (illustrative) | S | 50% |
One-time setup investment (illustrative) | I | $1,200 |
Assumptions to test before relying on the estimate
Time reduction: measure the complete before-and-after workload. The example below assumes 50% of baseline hours are eliminated only to illustrate the formula; it is not a typical outcome or a vendor promise.
Hours saved: count person-hours, not elapsed clock time. Include data preparation, analyst review, corrections, and recurring maintenance; compare reports with the same scope and frequency.
Labor value versus cash: hours released can create usable capacity while salaries stay unchanged. Claim cash savings only for costs actually avoided, such as overtime or contractor spend. Do not count both the same saved time and its redeployed analysis value as separate benefits.
Reality check: a result of less than two hours saved per week can be valid. Do not inflate the baseline to reach an expected return. Capture failed refreshes and extra review effort as costs, and include a low-benefit scenario.
Step‑by‑step ROI of automating weekly KPI reports with a worked example
Formulas you can audit and reuse:
Annual baseline labor value A = ((H × N × F) + (E × 12)) × R
Annual valued capacity released B = A × S; annual net economic benefit = B − C
First-year net benefit = B − C − I; first-year net ROI = (B − C − I) ÷ (C + I)
First-year ROI (%) = first-year net ROI × 100; benefit-cost ratio = B ÷ (C + I)
Illustrative economic payback (months) = I ÷ ((B − C) ÷ 12), only when B > C and I > 0, with benefits and recurring costs accruing evenly from go-live
Worked example using hypothetical USD amounts and a full year at steady operation; these are not customer results or a forecast:
H = 8 hours per contributor per week, N = 1, R = $60/hour, F = 52, E = 4 additional team hours/month, C = $3,600/year, S = 50%, and I = $1,200 upfront
Annual baseline labor value A = ((8 × 1 × 52) + (4 × 12)) × $60 = 464 hours × $60 = $27,840
Annual valued capacity released B = $27,840 × 50% = $13,920; annual net economic benefit = $13,920 − $3,600 = $10,320; first-year net benefit = $10,320 − $1,200 = $9,120
First-year net ROI = $9,120 ÷ ($3,600 + $1,200) = 1.90, or 190%; first-year benefit-cost ratio = $13,920 ÷ $4,800 = 2.90
Illustrative economic payback = $1,200 ÷ ($10,320 ÷ 12) = $1,200 ÷ $860 ≈ 1.40 months. This is based on monetized capacity, not demonstrated cash savings; use incremental cash flows for a cash-payback claim.
Sensitivity tips: vary the measured savings fraction, labor rate, recurring costs, implementation effort, and benefit ramp. A lower rate or smaller workload can make the same setup uneconomic. If B ≤ C, there is no payback of the setup investment under these assumptions; if C + I is zero, the ROI ratio is undefined. If benefits ramp gradually or costs are paid at different times, use a monthly cash-flow schedule. The simple example excludes discounting, taxes, and salvage value. Keep an editable calculator in your own workbook; no downloadable calculator is supplied with this article.
Implementation blueprint for measuring the result
Start with a quick pre‑automation audit. Identify one high‑value weekly report (for example, MRR for SaaS or ROAS for ecommerce), list the data sources, owners, and the current steps that consume time—pulling exports, aligning schemas, fixing IDs, and rebuilding charts. Define your canonical KPI calculations in plain language before you encode them. Establish validation checks you’ll run on every refresh: totals that must reconcile to the system of record, duplicate detection, missing‑value thresholds, and sanity ranges for key ratios.
SaaS MRR weekly workflow: obtain approved billing exports and account mappings. Define MRR as a monthly-normalized recurring amount at a stated snapshot date, not cash received or revenue earned during that week. Use consistent subscription status, discount, tax, and currency policies. Compare the same date and scope with the billing provider’s MRR report, investigating unexplained differences rather than accepting an arbitrary percentage gap. See Stripe’s MRR definitions and exports. Do not sum weekly MRR snapshots into a monthly revenue total. Publish or schedule distribution only through separately configured tools that actually support that workflow.
Ecommerce ROAS weekly workflow: obtain ad spend, orders, approved attribution data, and any customer or acquisition-cost records the KPIs require. Aggregate sources to a common campaign and period grain before joining to avoid multiplying spend or orders. ROAS is attributed revenue divided by ad spend with the same attribution policy; AOV is the defined order-revenue measure divided by completed orders. CAC also needs new-customer counts and the agreed sales-and-marketing cost scope; ad spend and order revenue alone do not establish it. Recompute ratios from their component totals rather than averaging channel ratios, and reconcile against matching sources with documented rounding and timing differences.
Quality assurance: Keep a short error log and require one weekly reconciliation sign‑off. If a figure drifts beyond a configured threshold, flag it and pause distribution until it’s reviewed. Sources like Databox and Klipfolio maintain practical guidance on KPI definitions, dashboards, and governance—for example, Databox’s reporting practices and data cleaning articles and Klipfolio’s KPI definition resources—which are useful references while you tighten your process. See Databox’s 2023 reporting overview in The State of Business Reporting and Klipfolio’s 2024 guidance to define KPIs and dashboard practices.
Neutral micro‑example using hiData
Here is an illustrative file-based reporting flow with hiData AI Sheets. Upload approved Excel or CSV exports, including the mapping table as a file. For an MRR review, provide documented monthly-normalized subscription amounts, status policies, snapshot date, and a comparable provider report. Ask to standardize account IDs, compare totals using the stated definitions, and show source rows for exceptions. Review the calculations and investigate every unexplained difference. Use the reviewed table and findings in AI Slides to draft an update, then approve its figures and narrative. This does not promise live Stripe or Google Sheets connections, scheduled execution, native Excel recalculation, automatic reconciliation approval, or a built-in audit log. Record preparation, review, and correction time during the pilot.
Risks, costs, and how to de‑risk rollout
Access and integration can take longer than expected if permissions and source availability are not settled. Begin with approved exports and one report owner, then expand after the process works. Definition drift also matters: publish a KPI dictionary and name an owner for changes. Keep one-time setup I separate from annual recurring cost C; do not charge the same setup amount twice through amortization and upfront investment. Estimate payback from the actual rollout timing and measurable benefits, not a promise that it arrives within a quarter. Add source connections or scheduled distribution only where those components are separately implemented and tested.
Methodology notes and sources
The worked example is an undiscounted, hypothetical economic model, not a forecast or a measured customer result. Its 50% savings assumption and $60 hourly rate are illustrative inputs. BLS provides a dated U.S. compensation reference, while the commissioned Forrester Fabric study concerns a larger composite enterprise and does not establish weekly-report savings or hiData performance. ICAEW and Stripe provide relevant spreadsheet-control and MRR definitions. The reporting-practice links below are background reading, not evidence for a universal ROI or time-saving range.
BLS 2025 compensation baseline: Employer Costs for Employee Compensation – June 2025
Commissioned enterprise context: Microsoft’s 2024 Fabric TEI summary, based on a modeled composite organization, not an SMB reporting benchmark.
Spreadsheet controls: ICAEW’s 20 principles for good spreadsheet practice.
Reporting practices and KPI definitions: Databox 2023 report and Klipfolio KPI guidance 2024
Recurring revenue definitions: Stripe Billing Analytics, including monthly normalization and downloadable reports.
To quantify your own ROI of automating weekly KPI reports, record the baseline, test one report, and compare measured residual effort with the estimate. A four-to-six-week pilot can be a planning choice, not a guarantee of a stable result. Use approved uploads in AI Sheets and reviewed presentation inputs in AI Slides where those steps fit, then decide whether the measured benefits justify expansion.
